Chemistry Reference
In-Depth Information
but the difference in tensile elongation may not be important or a significant
property for many applications.
One such method of determining significance is to perform a paired t-test,
also known as a two-sample t-test. This test assumes that the data are inde-
pendent and normally distributed. The value for t is the difference in means
divided by the square root of the sum of the square of the standard deviation
of the first set divided by the number of tests and the sum of the square of
the standard deviation of the first set divided by the number of tests. In the
example,
17
−
12
.
8
4
.
2
t
=
2
=
2
=
10
.
1
[(
0
.
68
)
2
∕
4
+(
0
.
48
)
2
∕
4
]
1
∕
[
0
.
173
]
1
∕
Tables of t values can be consulted to give the probability that there is a
difference between the two data sets. In this example, if the t value is greater
than 5.96 we can say that there is a greater than 99.9% probability that there is
a difference between the two data sets. Because the t value is 10.1 we can say
that there is greater than 99.9 % probability that the data for the blue airplanes
is different from the white airplane data. Another way to express this is to say
that there is a significant difference.
Continuing with the example, I decided to see how red paper worked. At
this time, all the classrooms were occupied so I conducted my test flights
outdoors. I made and flew four red paper airplanes and measured the distance
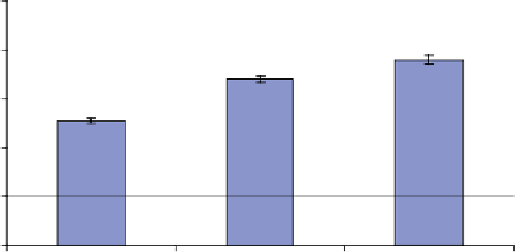
flown. They flew 18.8, 19.1, 18.5, and 19.6 feet. We can calculate that the
mean is 19.0 feet and the standard deviation is 0.41 feet (Figure 13.4).
The data indicates that red airplanes fly better than blue ones which in turn
fly better than white ones. How can this be true? Should we contact Boeing
and NASA about our discovery? The answer is that it is not true. The color
25
20
15
10
5
0
White
Blue
Red
Figure 13.4
White versus Blue versus Red Paper Airplane Flights


Search WWH ::

Custom Search