Java Reference
In-Depth Information
If the graph indicates a high number of surviving generations between garbage
collections, then we might have a memory leak in our application.
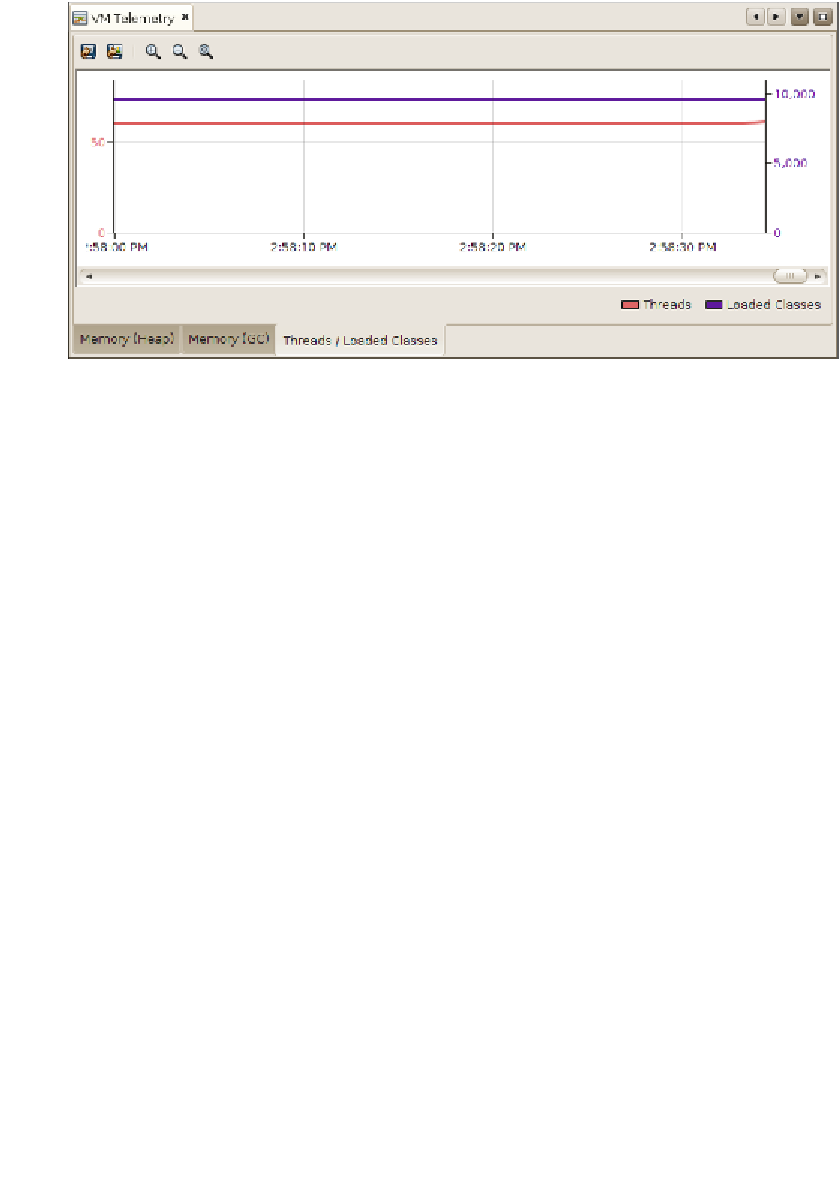
The graph on the right tab of the
VM Telemetry Overview
window indicates the
number of active threads and the number of loaded classes in our application.
Summary
The NetBeans profiler is a very valuable tool in identifying performance problems
in our applications. It provides several useful tools to aid us in identifying poorly
performing code, as well as allow us to easily monitor memory usage and object
allocation in our applications. More information about the NetBeans profiler can be
found at
http://profiler.netbeans.org/
.