Java Reference
In-Depth Information
As we can see, the NetBeans profiler can be very helpful in pinpointing areas of our
application that are having performance problems, allowing us to easily identify
these areas so that we can better focus our performance optimization efforts.
Although this information is very valuable, it is by no means the only information
we can obtain from the NetBeans profiler. We can see how much memory our
application is using by simply opening the
VM Telemetry Overview
window by
clicking on the
VM Telemetry
icon on the Profiling control panel.
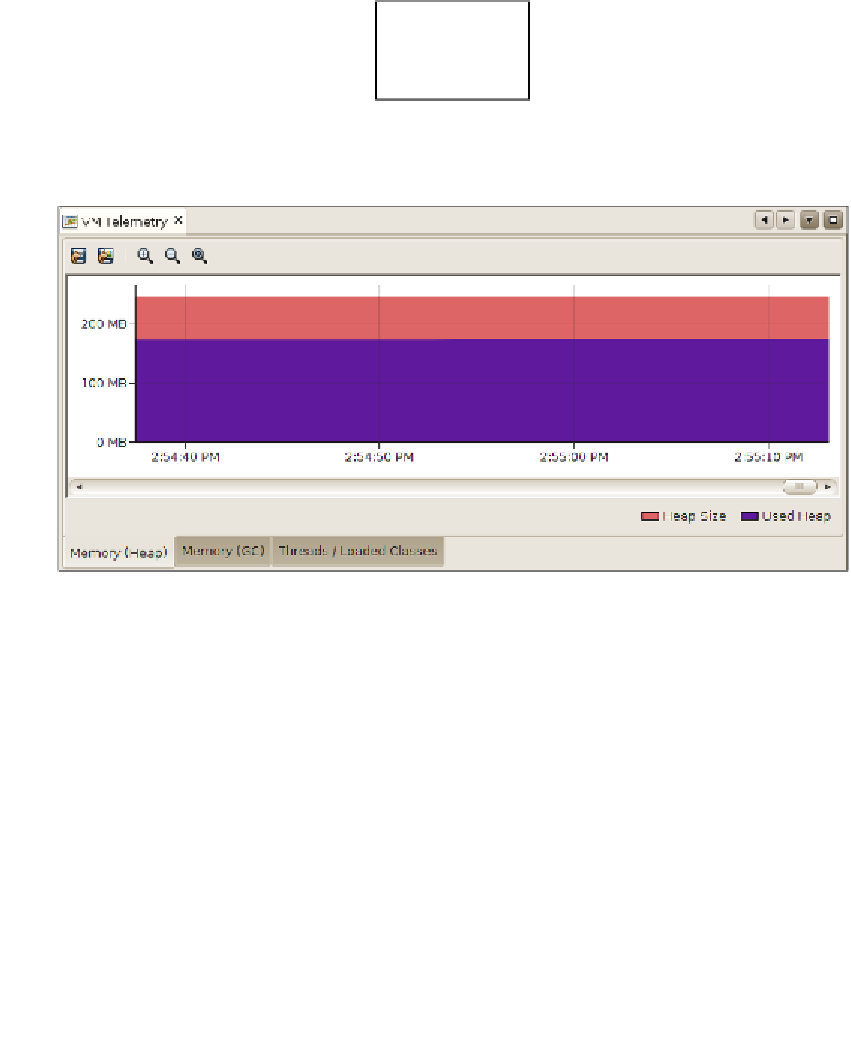
After clicking the VM Telemetry Icon, the
VM Telemetry
window opens. This
window has three tabs:
The graph on the left tab shows (in red) the total amount of heap allocated in our
application's Java Virtual Machine. Additionally, it also shows the total amount of
heap used by our application.