Information Technology Reference
In-Depth Information
Table 2.
Result of 1000 games for MS-TD learning
\Depth
Reaching ratio\
1
3
5
7
2048
97.1%
99.9%
100.0%
100.0%
4096
88.9%
99.8%
100.0%
100.0%
8192
67.3%
96.9%
98.9%
98.5%
16384
18.1%
73.5%
80.7%
80.2%
32768
0.1%
9.4%
10.9%
4.6%
Maximum score
447456
536008
605752
581416
Average score
143473
310242
328946
313776
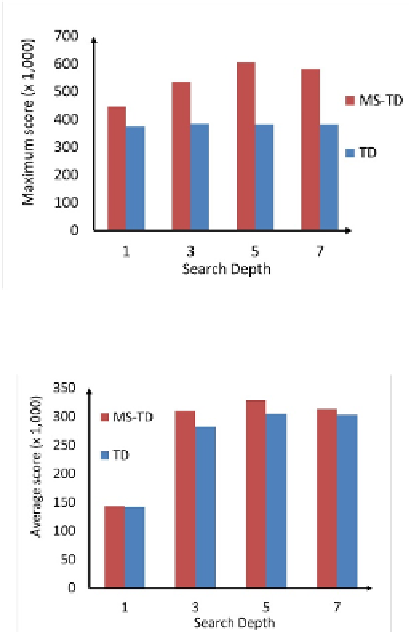
Table 1 shows the performance results of running 1000 games for the original TD
learning in depths 1, 3, 5 and 7, respectively, while Table 2 shows those for MS-TD
learning with three stages. Note that all the reaching ratios of all 16384-tiles and
smaller tiles are the same, since both uses the same feature weights during the first
stage. Besides, the comparisons between the two learning methods in the maximum
scores and the average scores are shown in Fig. 9 and Fig. 10, respectively.
Fig. 9.
Comparison of maximum scores
Fig. 10.
Comparison of average scores


Search WWH ::

Custom Search