Information Technology Reference
In-Depth Information
0.95
0.95
0.85
0.85
Upper bound
Proposed
approach
Random
Upper bound
Proposed
approach
Random
0.75
0.75
ġ
ġġ
ġġġ
ġ
ġġ
ġġġ
0.65
0.65
Lower bound
Lower bound
0.55
0.55
0.45
0.45
0.35
0.35
0
100
200
300
400
500
600
700
800
900
1000
0
100
200
300
400
500
600
700
800
900
1000
(a) Movie
→
Restaurant
(b) Hotel
→
Restaurant
0.9
0.9
0.85
0.85
Upper bound
Proposed
approach
Random
Lower bound
Upper bound
Proposed
approach
Random
Lower bound
0.8
0.8
ġ
ġġ
ġġġ
ġ
ġġ
ġġġ
0.75
0.75
0.7
0.7
0.65
0.65
0.6
0.6
0
100
200
300
400
500
600
700
800
900
1000
0
100
200
300
400
500
600
700
800
900
1000
(c) Restaurant
→
Movie
(d) Hotel
→
Movie
0.9
0.9
0.85
0.85
0.8
0.8
Upper bound
Proposed
approach
Random
Upper bound
Proposed
approach
Random
0.75
0.75
ġ
ġġ
ġġġ
ġ
ġġ
ġġġ
0.7
0.7
0.65
Lower bound
0.65
Lower bound
0.6
0.6
0.55
0.55
0.5
0.5
0
100
200
300
400
500
600
700
800
900
1000
0
100
200
300
400
500
600
700
800
900
1000
(e) Restaurant
→
Hotel
(f) Movie
→
Hotel
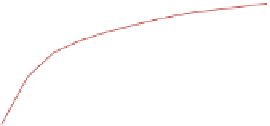
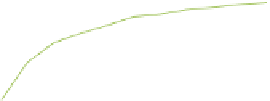
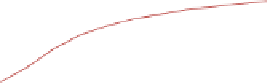
Fig. 2.
Cross-domain performance in all the six source-target domain pairs
Tabl e 3.
The ratio of the tokens of the target-domain dataset (
D
T
) appearing in the
source-domain dataset (
D
S
)
Source
Restaurant Movie Hotel
Restaurant
-
27.1%
35.8%
Target
Movie
32.6%
-
33.0%
Hotel
33.5%
25.7%
-
our QBC-based method. The stop criteria threshold
t
is set to 0.003.
A
denotes
the average number of human annotated sentences in thirty datasets. Table 4
shows the summarized results.


Search WWH ::

Custom Search