Information Technology Reference
In-Depth Information
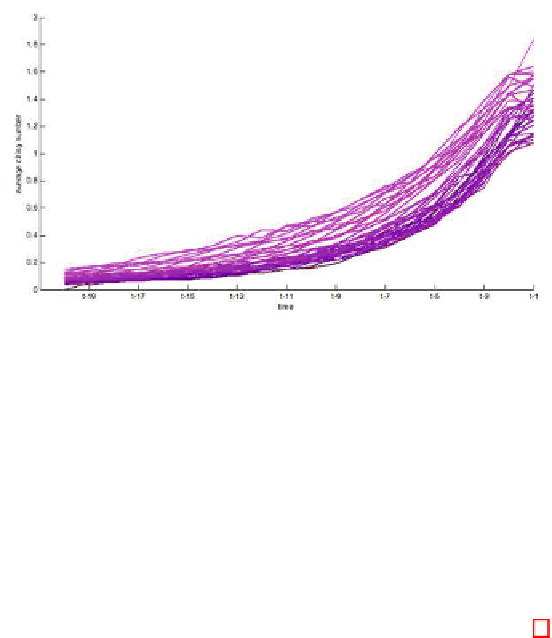
Fig. 2.
Average citations of papers in the APS citation network dataset. Each curve
is for the papers published in one year from 1970 (darkest) to 2009 (brightest). The
curve plots the change of the average citations to the past years. The horizontal-axis
indicates how many year from the publication time
t
.
steps (
i.e.
, year, in this case) early.
ʓ
C
(
t, ˄
) can be estimated and presented as
a data point on a curve in the plot.
Consider the problem of computing
ʦ
. If we consider paper
j
C
t
as a random
variable, then
ʦ
t
(
C
) is by definition the expectation of
ˆ
(
j
). The number of
citations from
j
to papers published in time
t
∈
˄
will also be a random variable
and its expectation will be
ʓ
C
(
t, ˄
). Then the expected contribution of these
citations to
ˆ
(
j
) will be
ʓ
C
(
t, ˄
)
·ʱ·ʦ
t−˄
(
C
) approximately. Figure 3 illustrates
this idea. Therefore, we can derive an approximation of
ʦ
as follows:
−
ʦ
t
(
C
)=
E
j∼C
t
[
ˆ
(
j
)]
⊡
⊣
⊤
⊦
t
ʱ
i∈C
t−τ
=
E
j∼C
t
I
[
i ∈ cite
(
j
)]
ˆ
(
i
)
τ
=1
t
[
I
[
i ∈ cite
(
j
)]]
E
i∼C
t−τ
[
I
[
i ∈ cite
(
j
)]
,ˆ
(
i
)]
(4)
ʱ
E
i∼C
t−τ
=
[
ˆ
(
i
)] + cov
i∼C
t−τ
τ
=1
t
≈
ʱʓ
C
(
t, ˄
)
ʦ
t−τ
(
C
)
.
(5)
τ
=1
We note that
I
[
s
] is the identity function that returns 1 if the parameter
s
is true and 0 otherwise. The difference between the approximation (5) and
(4) is the sum of the covariance terms in (4). These terms are zero under the
assumption that the cascade function value
ˆ
of a paper, which depends on how
many papers it cites, and how often it is cited in the future, are uncorrelated.
The assumption is reasonable and can be confirmed empirically. Therefore, we
expect that the approximation error will be negligible.
Compared to an exhaustive search algorithm, computing
ʦ
t
(
C
)usingEq.(5)
reduced the complexity from exponential to quadratic. Since the equation is
defined recursively, there are plenty of room to optimize its implementation.


Search WWH ::

Custom Search