Biology Reference
In-Depth Information
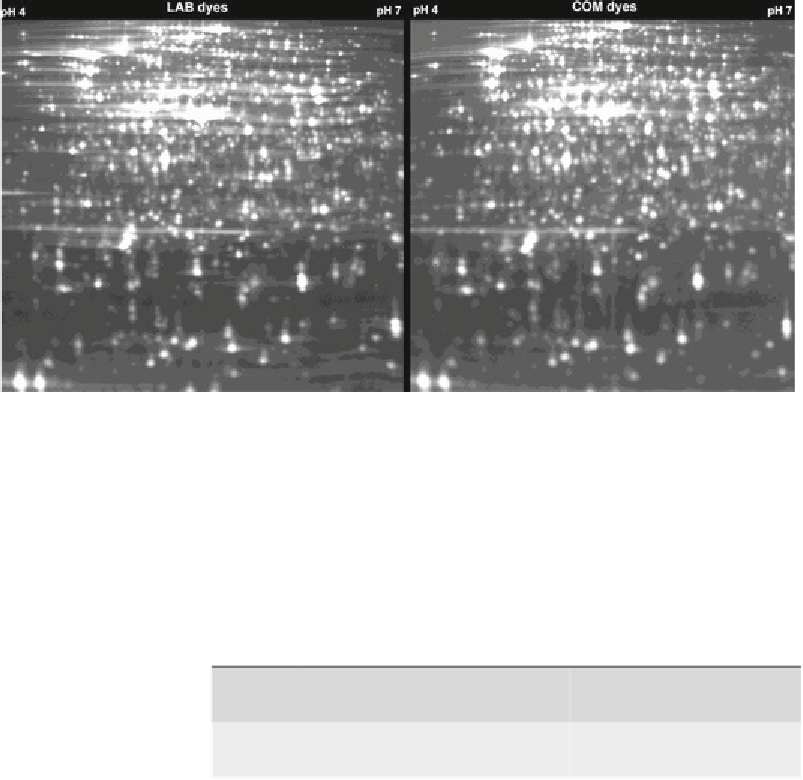
Fig. 4. Gel images of
Escherichia coli
protein samples labeled with newly synthesized (LAB) and commercial (COM) dyes.
Spot patterns produced by using the two different dyes for labeling are remarkably similar.
Table 1
Comparison of spot maps for samples labeled with LAB
and COM dyes
Number of detected spots
(per gel, 1 through 5)
Standard
deviation CV (%)
Sample
Mean
LAB
2,172 (1), 2,143 (2), 2,243 (3),
2,090 (4) 1,990 (5)
2,128
95
4.5
COM
2,000 (1), 2,071 (2), 2,166 (3),
2,376 (4), 2,204 (5)
2,163 143
6
To check for similarities, individual spots average ratio mea-
surements and an automated POI selection fi lter was then applied,
and 37 protein spots were selected that satisfi ed the selection criteria,
as described in Subheading
3.2.4
above. Out of 37 spots passing
the fi lter, 27 were found to be upregulated in Fis
−
cells, and 10
protein spots were downregulated in Fis
−
cells, as compared to WT
(see Note 3).
Comparison of average ratios in protein abundance for all 37
spots plotted in Fig.
5
shows that selected spots in both LAB- and
COM-labeled samples are very similar. As shown in Table
2
, the
difference in average ratios for the majority of protein spots in both
LAB and COM samples is small, as 29 spots (80% of total) differ
less than 5% from each other, while the rest of the spots differ by
no more than 15%. Paired Student's
t
-test analysis performed on


Search WWH ::

Custom Search