Biology Reference
In-Depth Information
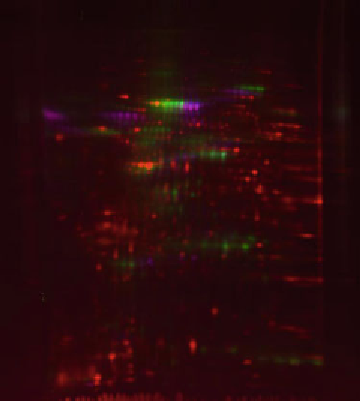
Fig. 3. Qualitative 2D DIGE comparison of samples for the detection of contaminations
using IPG pH 4-10NL for the fi rst dimension and SDS-PAGE (10-15% T) for the second.
Red
spots show the protein pattern of a lysate from peritoneal murine macrophages
(25
m
g protein, 4 nmol Cy2 per mg protein),
green
ones belong to mouse serum (pro-
tein amount corresponding to 0.1
m
L of serum; Cy5).
Pure blue
spots derive from FCS
(protein amount corresponding to 0.1
m
L of serum; Cy3), but appear
violet
due to the
overlap with
red
spots from the macrophage lysate.
Fig. 4. Qualitative or semiquantitative 2D DIGE comparison of samples for the mapping of
genetic polymorphism. Two different horse serum samples were labeled with Cy3 and
Cy5, respectively, using IPG pH 4-10NL for the fi rst dimension and SDS-PAGE (10-15% T)
for second. A “zoom-in” of the gel image is shown with the protein “Pi” (
a
1
-antitrypsin)
marked with an ellipse.
known to exist in numerous phenotypes, giving complex elec-
trophoretic patterns. In “pre-genomics time” this feature was
used in different electrophoretic setups for parentage testing
and breeding control. When separating samples with different
isoform patterns on conventional and separate 2DE gels, exact
assignment of spot positions can be diffi cult.

Search WWH ::

Custom Search