Biology Reference
In-Depth Information
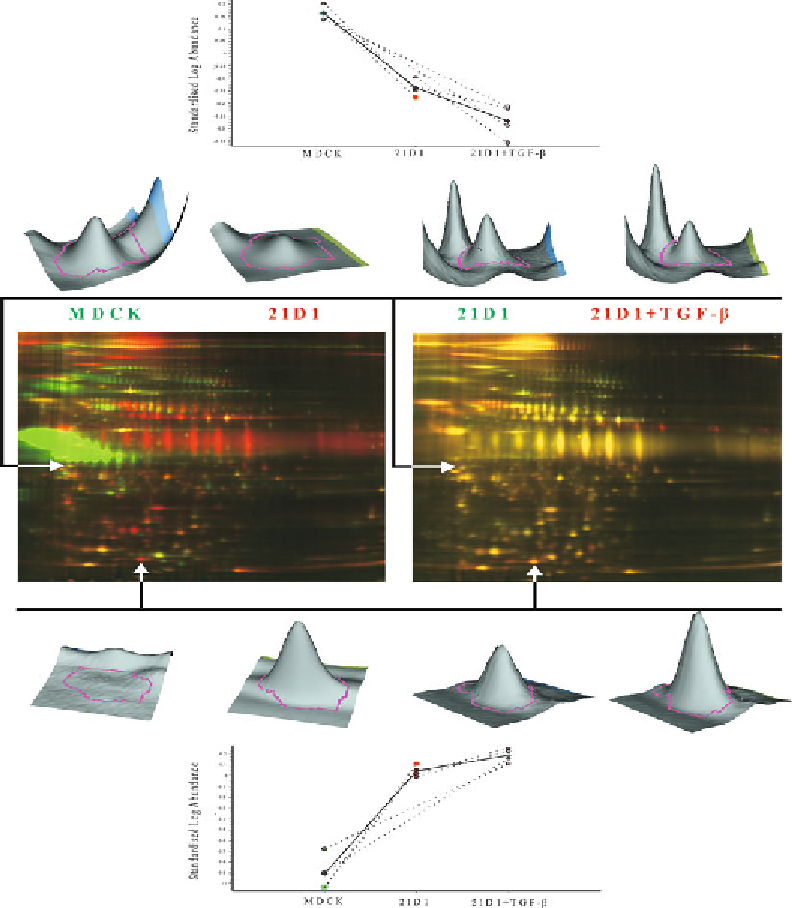
Fig. 2. DIGE analysis of MDCK cell secretome perturbations during oncogenic Ras/TGF-
β
EMT. Secretome was collected from
MDCK, 21D1, and 21D1 cells stimulated with TGF-
β
for comparative proteomics. The 2D gel images are representative spot
maps showing proteins that are differentially expressed as a consequence of EMT.
Green spots
on the
left gel
highlight
proteins more abundant in the MDCK secretome (Cy3), while
red spots
indicate proteins that are highly expressed in the
secretome of 21D1 cells (Cy5). Comparison of 21D1 cells with or without TGF-
β
stimulation (
right gel
) reveals that secretome
protein expression remains largely unchanged. For this reason, the majority of spots appear
yellow
(i.e., co-expressed),
although there are some spots that are slightly
red
(further upregulated) or
green
(further downregulated). Above and below
the gels are 3D images enabling visualization of specifi c spot intensities, and graphical depiction of protein expression. Thus, the
abundance of a particular protein can be easily assessed across all samples. For example, the
top panel
illustrates a down-
regulated protein, while the
bottom panel
represents a protein that is upregulated by oncogenic Ras and TGF-
β
. For a detailed
list of MDCK cell secretome proteins that are signifi cantly dysregulated during oncogenic Ras-induced EMT see ref.
36
.
Search WWH ::

Custom Search