Biology Reference
In-Depth Information
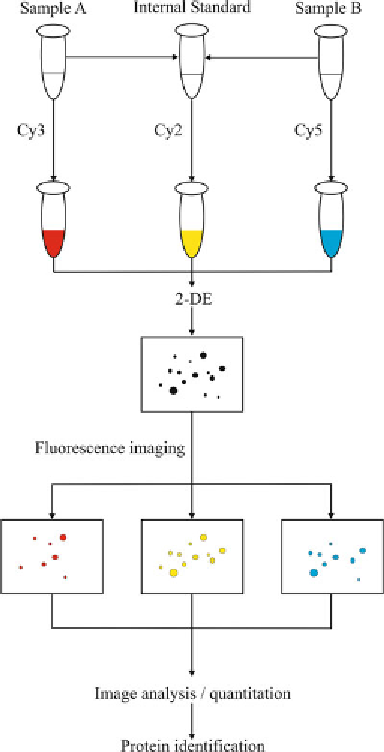
Fig. 1. Two-dimensional fl uorescence difference gel electrophoresis (DIGE). Different
protein samples are labeled with Cy3 and Cy5 dyes, while an internal standard consisting
of equal amounts of each protein sample is labeled with Cy2. The internal standard serves
to normalize for gel-to-gel variation, and thereby distinguishes biological from experimen-
tal variation. All three CyDye-labeled samples are pooled and resolved by 2DE on the
same gel. Individual protein spot maps are obtained by excitation and emission of each
CyDye fl uorophore, and images are overlaid to reveal proteins that are differentially
expressed. Color dominance represents protein abundance. For example, proteins more
abundant in sample A appear
red
, those in sample B appear
blue
, and those equally
expressed between samples are
purple
. Image analysis software incorporating each
sample and the internal standard allows comparison across multiple gels, and enables
fold-change determination of protein spots that are either up- or downregulated. Following
statistical analysis, protein spots of interest are excised and subjected to LC-MS/MS for
protein identifi cation.
Search WWH ::

Custom Search