Biology Reference
In-Depth Information
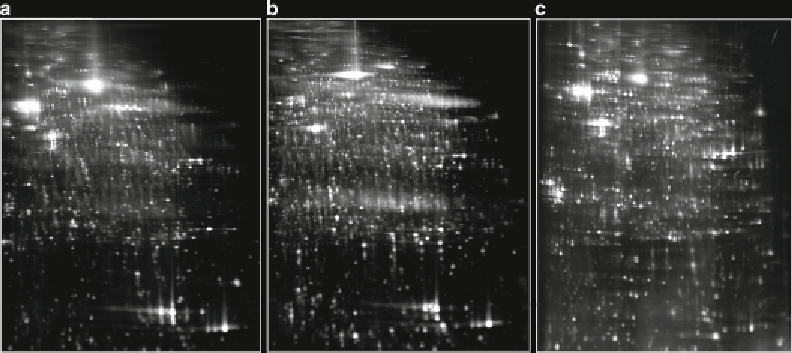
Fig. 5. Representative gels from the 2D DIGE analysis. The internal standard (reference e, labeled with Cy3) (
a
) comprises
grade 2 and grade 3 tumor tissue. In the analysis, bronchial epithelium (
b
) was compared to squamous cell carcinoma
(SCC) tumor cells (
c
) (both labeled with Cy5).
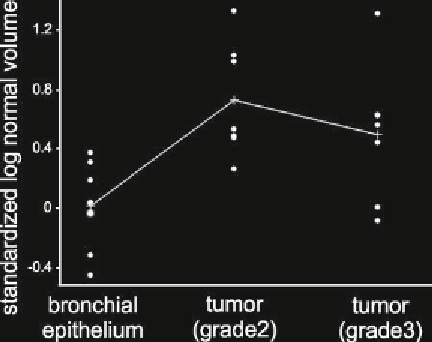
Fig. 6. Example of a differentially regulated protein found by image analysis and identifi ed by mass spectrometry. Annexin
A2 has been found to be higher abundant in tumor cells (both grade 2 and grade 3 tumors) compared to bronchial epithelium
cells. The
circles
represent individual spot volumes and crosses the group means.
Variation Analysis (BVA) mode of Decyder (see Note 10). Let
the software perform a statistical analysis between the control
group (microdissected bronchial epithelium cells) and both
disease groups (microdissected grade 2 and grade 3 tumor
cells). Consider only protein spots with an expression fold-
change of >3.4 and
p-
value (Student's
t
test) <0.05 as signifi -
cantly regulated and review spots carefully (see Fig.
6
).
Search WWH ::

Custom Search