Biology Reference
In-Depth Information
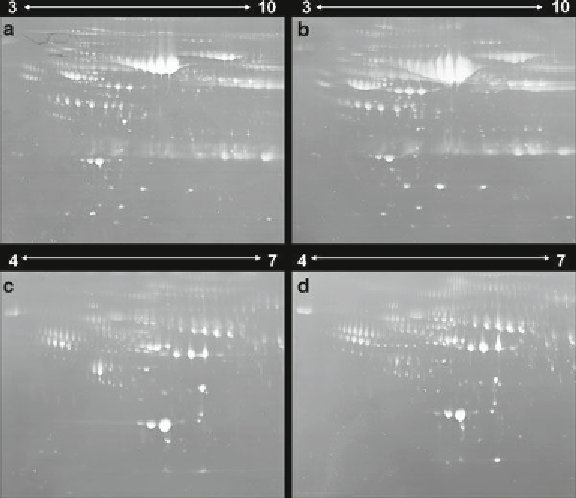
Fig. 1. 2DE image patterns of whole plasma and high-abundance protein (HAP)-depleted
plasma by MARS. One milligram of whole plasma (
a
,
b
) and HAP-depleted plasma (
c
,
d
)
for “normal” (
a
,
c
) and “HCC” (
b
,
d
) .
Biotech; ProteoPrep
®
20 Plasma Immunodepletion Kit, Sigma-
Aldrich; etc.). We used MARS (Agilent) for depletion of six HAPs
(albumin, IgG heavy and light chain, alpha-1-antitrypsin, IgA,
transferrin, haptoglobin), and the recovery of low-abundance
proteins was about 10%. The HAP depletion of C (normal) and
D (HCC) shows clearer spot images than those of A and B, but
many spots appear to be clustered. To solve these problems, we
applied narrow-pH-range strips (single p
I
, 1.0) and run the 2D
DIGE to minimize spot intensity variations. In Fig.
2
, the pro-
tein spots shown in a wide-pH-range strip were separated well,
and many spots appeared to be differentially expressed. Some of
the 43 target spots identifi ed by MALDI-TOF MS turned out
to be the same protein with different p
I
on the 2-D gel
(Table
2
), indicating that these are modifi ed (e.g., by glyco-
sylation or phosphorylation).
3.3. Image Analysis
and In-Gel Tryptic
Digestion
1.
Load the DIGE images of the gels into the DeCyder program.
Group the images as “Standard,” “Normal,” or “HCC” in
accordance with Table
1
. Set the estimated number of spots for
each codetection procedure to “2500” and select “Student's
t
test” as the test for statistical confi dence of the analysis. Perform
intra-gel analysis and spot matching using the difference in-gel
Search WWH ::

Custom Search