Biology Reference
In-Depth Information
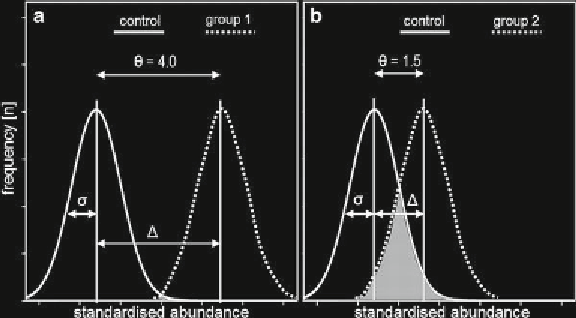
Fig. 2. Two examples for the relationship between the difference in mean standardized
abundance (
D
) and the effect size (
q
). The effect size of control vs. group 1 is 4.0 and of
control vs. group 2 is 1.5. The graphs show the different degree of overlap (indicated in
gray
) of the distributions of expression values of the control and the respective group.
(independent or dependent) according to your study design.
Activate the Average Ratio and the Student's
t
test option and
defi ne the two experimental groups which should be com-
pared. Finally, select the FDR option.
7.
The DeCyder software package expresses the degree of dispar-
ity in spot mean abundance between two experimental groups
as “average ratio” or “av
R
.” Other software packages and
many publications use the term “fold-change” for the same
value. av
R
derives from the ratio of the mean standardized
abundances (here termed
R
¢):
(a)
R
¢=
meanSA / meanSA .
1
c
(b) If
R
¢ > 1, then av
R
=
R
¢.
(c) If
R
¢ < 1, then
av 1
R R
mean SA
1
or
c
mean stan-
dardized abundance of group-1 and control, respectively.
Note that the “average ratio” (or “fold-change”) should
not be confused with the effect size (
q
). Although both measures
are used to describe the disparity in expression of a protein,
only the effect size considers the standard deviation (and hence
the biological variation). Accordingly, the “average ratio” can-
not directly be converted to effect size.
=-
¢
8.
According to the guidelines of the European (EMA) and the
American (FDA) regulatory agencies, the maximal allowed
technical variation of routine diagnostic methods (e.g., ELISA)
is 20% (
14, 15
). It seems therefore reasonable to include only
spots with an average ratio above ±1.2 in the validation
experiment.
9.
If several statistical tests are being performed simultaneously,
controlling the FWER to adjust for multiple testing is more
Search WWH ::

Custom Search