Biology Reference
In-Depth Information
As in the single-hypothesis case, for sample size calculations in
proteomic studies, assumptions on the effect sizes of the effective
proteins have to be made. In clinical practice, it may be useful to
specify the minimum effect size the experimenter wants to detect
and therefore assuming in the sample size calculations that all effec-
tive proteins have the same effect size. For this assumption, sample
size calculations become easier. In the sample size calculations for
proteomic studies (and thus in the context of multiple testing),
one also needs to make assumptions on the proportion of effective
proteins among all investigated proteins. Note that using Storey's
approach, this (unknown) proportion is important for the sample
size calculations and not the total number of investigated proteins.
The existing methods for sample size calculations generally assume
independence of test statistics. This may not be a realistic assump-
tion; however, when accounting for correlation in the sample size
calculations, one also has to specify the size and type of correlation
between the test statistics, which may be diffi cult in praxis.
In the outline provided below, we try to guide the researcher
through the above indicated statistical considerations and explain
them with practical examples.
2. Materials
2.1. Sample Size
Calculations
The sample size calculations can be performed using the graphs
shown in Fig.
1
and the data in Table
2
. They were calculated
using the software R (Version 2.11.1;
http://www.r-project.org
).
2.2. Statistical
Evaluation
of the DIGE Gels
The statistical evaluation can be done using the DeCyder Software
package (Versions 6.5; GE Healthcare, Uppsala, Sweden).
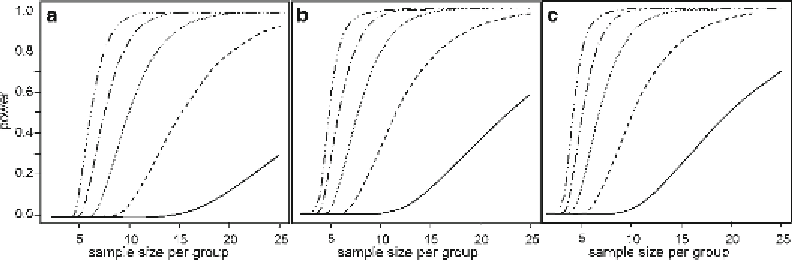
Fig. 1. Statistical power as a function of the sample size of each group for different proportions of effective proteins (graph
(
a
):
p
1
= 0.01, graph (
b
):
p
1
= 0.05, and graph (
c
):
p
1
= 0.1) and different effect sizes (
solid line
:
q
= 1,
dashed line
:
q
= 1.5,
dotted line
:
q
= 2,
dot-dashed line
:
q
= 2.5, and
dot-dot-dashed line
:
q
= 3). The calculations are based on two-sided
two-sample
t
tests and an FDR of 0.05.
Search WWH ::

Custom Search