Biology Reference
In-Depth Information
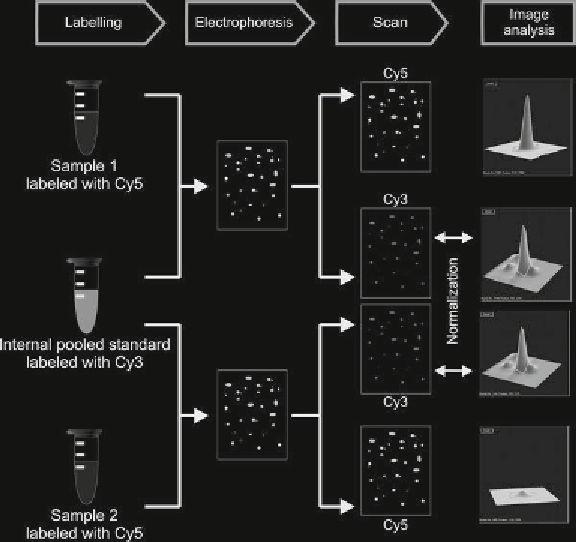
Fig. 2. Schematic representation of a saturation DIGE experiment.
In a typical saturation DIGE experiment (see Fig.
2
for graphical
overview), one dye is used for the labeling of individual samples,
while the other is used as a label for the so-called internal pooled
standard (IPS), which consists of aliquots from each of the samples
used within the study. As a consequence, each individual spot present
in any of the samples is also represented by a spot in the IPS.
Cysteine coupling of Cy3 and Cy5 does not affect protein IP, and
the dyes are almost perfectly size-matched. Furthermore, fl uores-
cence emission characteristics of Cy3 and Cy5 are different, and
therefore, a co-separation of a Cy5-labeled sample and a Cy3-labeled
IPS on each gel is possible. After electrophoresis, two images from
each gel, representing the sample and IPS, respectively, are gener-
ated by a fl uorescence scanner. Further image analysis is performed
with a dedicated software, e.g., DeCyder (GE Healthcare). Being
present in the same amount on each gel, the IPS is a perfect reference
to normalize for inter-gel variances with respect to spot coordinates
and spot intensities. For each spot on each gel, the intensity ratio
between sample and IPS is calculated. After matching of individual
gels based on the IPS readout image, statistical analysis can be per-
formed to calculate signifi cant spot intensity differences among
individual samples or sample groups and calculate an abundance
ratio for the corresponding proteins.
Search WWH ::

Custom Search