Information Technology Reference
In-Depth Information
333
Pages
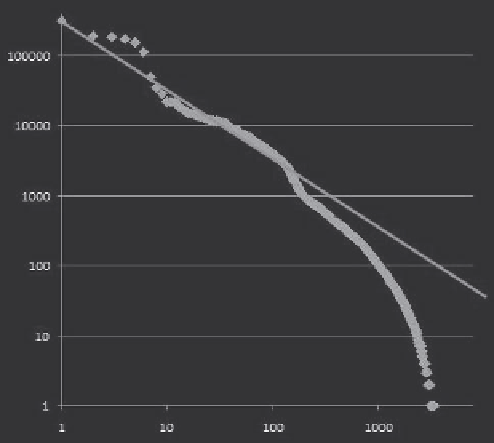
Figure 13.8
The number of visits per page in a double-logarithmic chart, example 2
Figure 13.8 tells a different story; there might be an opportunity to optimize for
more traffic if we assume that the long tail should be inversely proportional and fol-
lows a power law. if that is the case, it becomes obvious that we are missing content to
fill up the tail. the client, with the dataset shown, simply does not have enough content
to support the long tail.
as you know, revenue is derived from content; thus, any additional visits and
by that additional page views could realistically increase revenue. with our example
dataset, the perfect distribution would roughly add an additional 1.7 million visits per
week. it would also mean that they had to move from some 3,600 content pages to
more than 300,000 content pages.
making this even more concrete, let's assume that the cost per thousand impres-
sions (Cpm) is $2 and that each visit resulted in five page views. Under this assump-
tion, we'd generate an additional $17,000 per week in revenue.
now comes the billion-dollar question: would this increase in revenue offset the
cost of creating 300,000-plus pages? does the content owner have a realistic opportu-
nity to create this many more pages? a handy way to create content quickly and fill out
the long tail might be to unleash one of your internal databases and make it publicly
available.
i discuss this subject in the following post:
http://visualrevenue.com/blog/2007/03/long-tail-and-how-to-calculate-
missing.html