Information Technology Reference
In-Depth Information
this is not a complete list. you might want to take a more scientific approach to
this, such as applying a customized engagement metric. But whatever you do, first have
a look at one or more of these prequalification metrics and see if there are any behav-
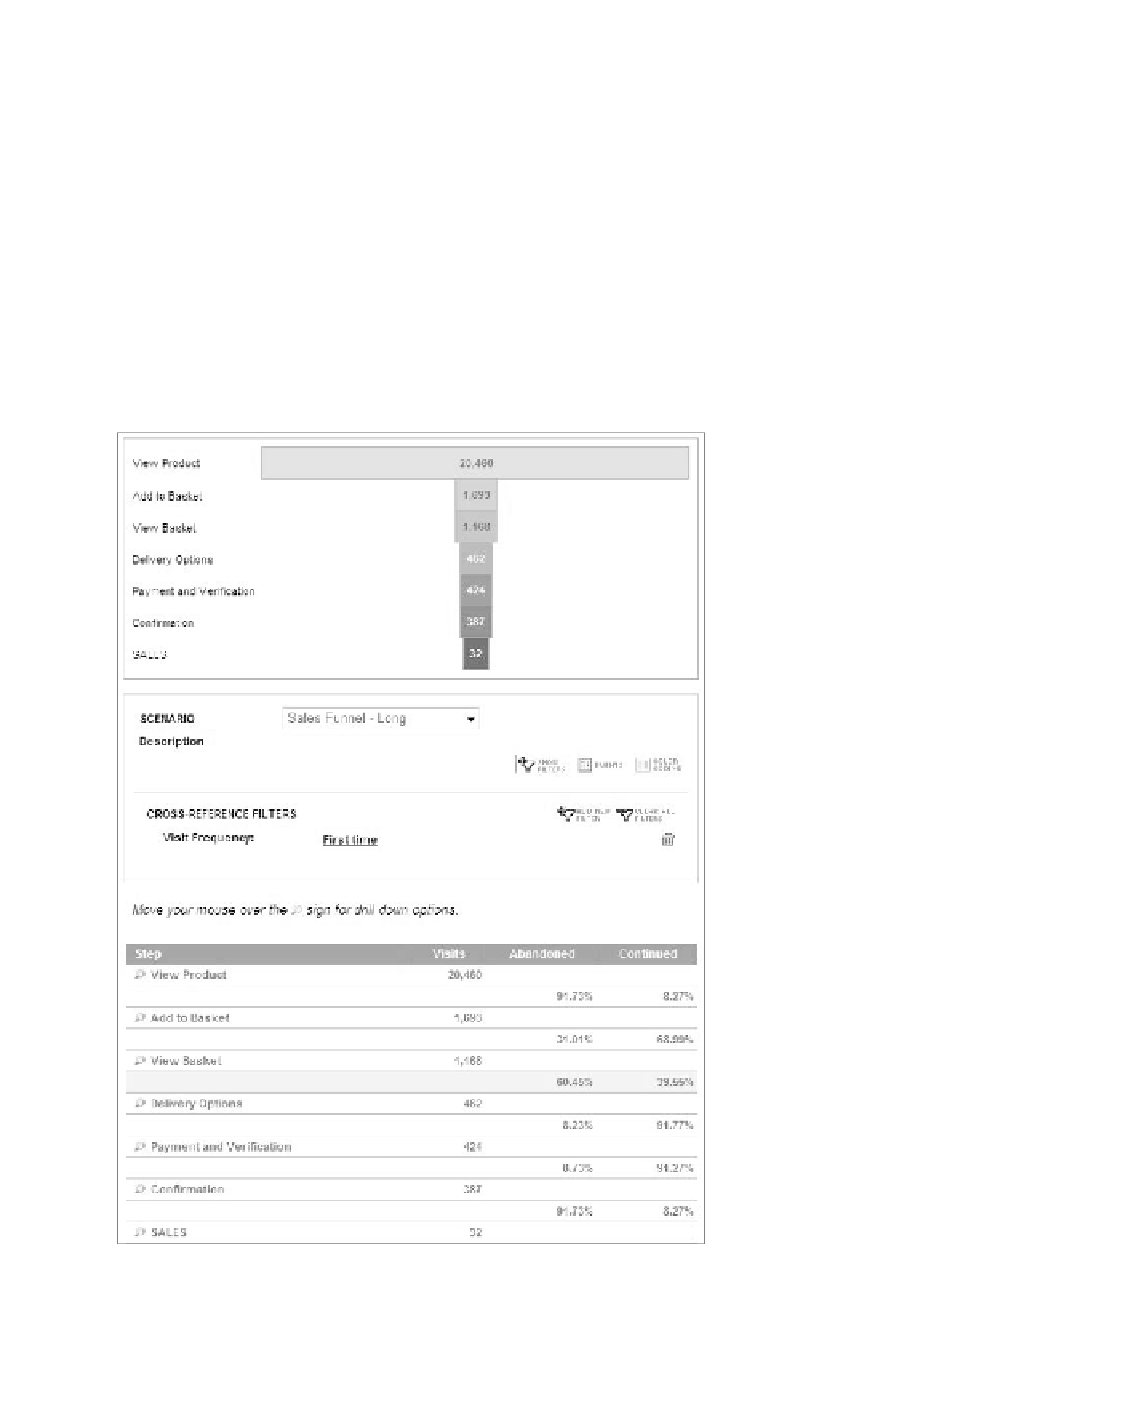
ioral differences. this is exactly what i did in Figure 12.5 and Figure 12.6, using the
metrics First time Visitors and returning Visitors.
looking at not just the actual conversion rate, but also the details on every one
of the steps, you can see that the previous two figures show a reasonable level of simi-
lar behaviors. the biggest dissimilarity is the difference in abandonment from viewing
the basket to choosing and agreeing to the delivery options. First-time visitors abandon
this at approximately 60 percent and returning visitors at approximately 40 percent.
309
Figure 12.5
A funnel filtered on the prequalification metric First Time Visitors