Information Technology Reference
In-Depth Information
Figure 9.32
The result of the values added in Figure 9.31
The trend chart dashboard item contains a resolution tab, which allows you
to select the time unit on the dashboard element. You can select hour, Day, Week, or
Month depending on the reporting period you initially selected. if the reporting period
for a trend dashboard element is set to Year, then the resolution tab will not contain
the hour option.
The time unit you select is saved and the page is refreshed. Your selected time
unit will be maintained until you make a new selection. This feature helps you avoid
unsatisfactory displays in which accumulating data is trending downward if the
selected period extends into the first few days of a given month.
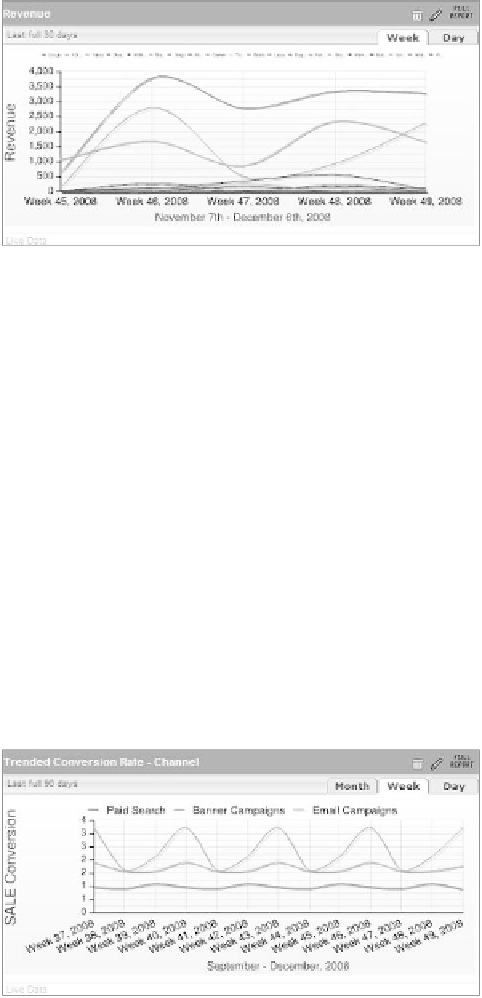
i created, for inspiration purposes, a second trend chart example, shown in Fig-
ure 9.33, the trended visit-to-sale conversion rate segmented on campaign sources.
one thing that annoys me a bit is that Yahoo! displays too many items in the top
group you apply. if you look at Figure 9.32, we would have been better off with a top 5
or an option to choose how many items in that category we would like to display.
245
Figure 9.33
Trended conversion rate dashboard item with channel top group
Notes
The notes dashboard item from Yahoo! lets you add notes and subsequently edit them.
i am ambivalent when it comes to notes. if we think about the perfect dashboard and