Information Technology Reference
In-Depth Information
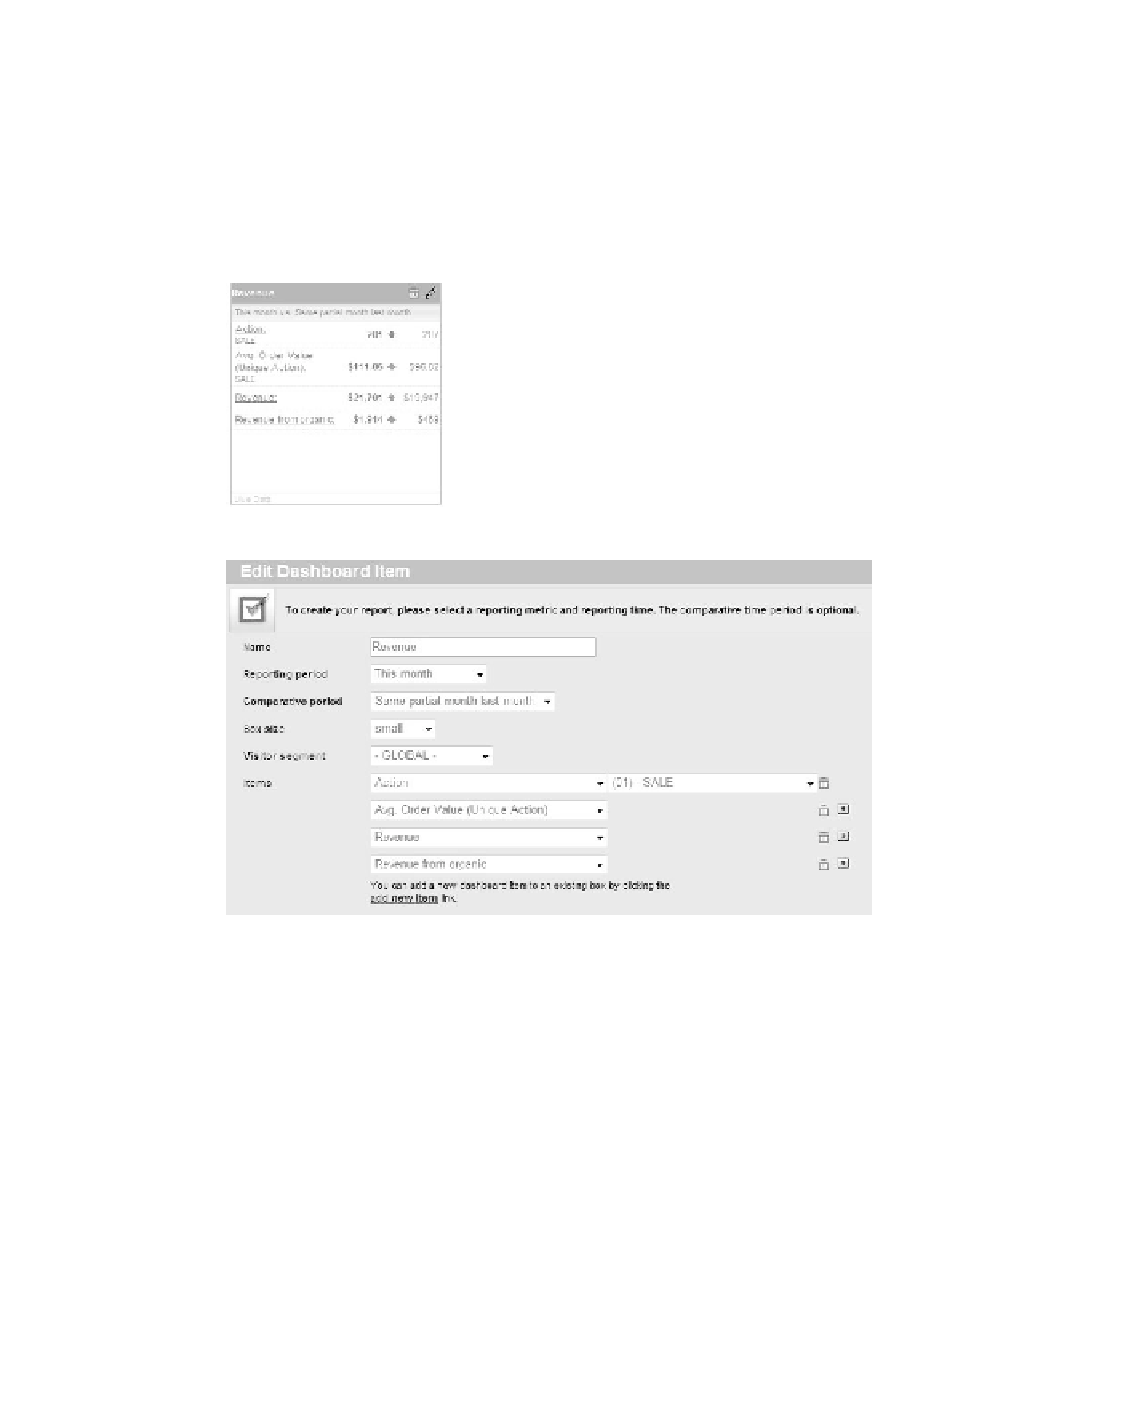
in Figure 9.24 multiple metrics are presented in one KPi box.
The KPi box typically appears in the upper-left corner and is thus the most vis-
ible box you have. so to make it more appealing, sort the order of the individual KPis
in the box (see Figure 9.25).
While not the perfect sorting mechanism, it will do what you need.
Figure 9.24
Multiple
metrics in one KPI box
240
Figure 9.25
Sorting and managing KPI box items
Gauge
i am not too fond of gauges as central dashboard items in general, but let me begin
with the facts about gauges in Yahoo! Web analytics.
a gauge displays fluctuating data such as the bounce rate or conversion rate. at
the same time, it allows you to display the performance of the KPi. The performance is
displayed as green, yellow, and red and is based on your own set targets.
The most important thing to remember about gauges is that they do not function
very well, if at all, on accumulating data values, such as visits, page views, or revenue.
The reason that gauges are not working for such metrics is that the metric value will be