Information Technology Reference
In-Depth Information
The Delete function will warn you before the item is deleted, and once the item is
deleted, you are forced to create a new item; there is no undo for this function. This is
all about visualization, so no data is deleted. The edit function will take you back to
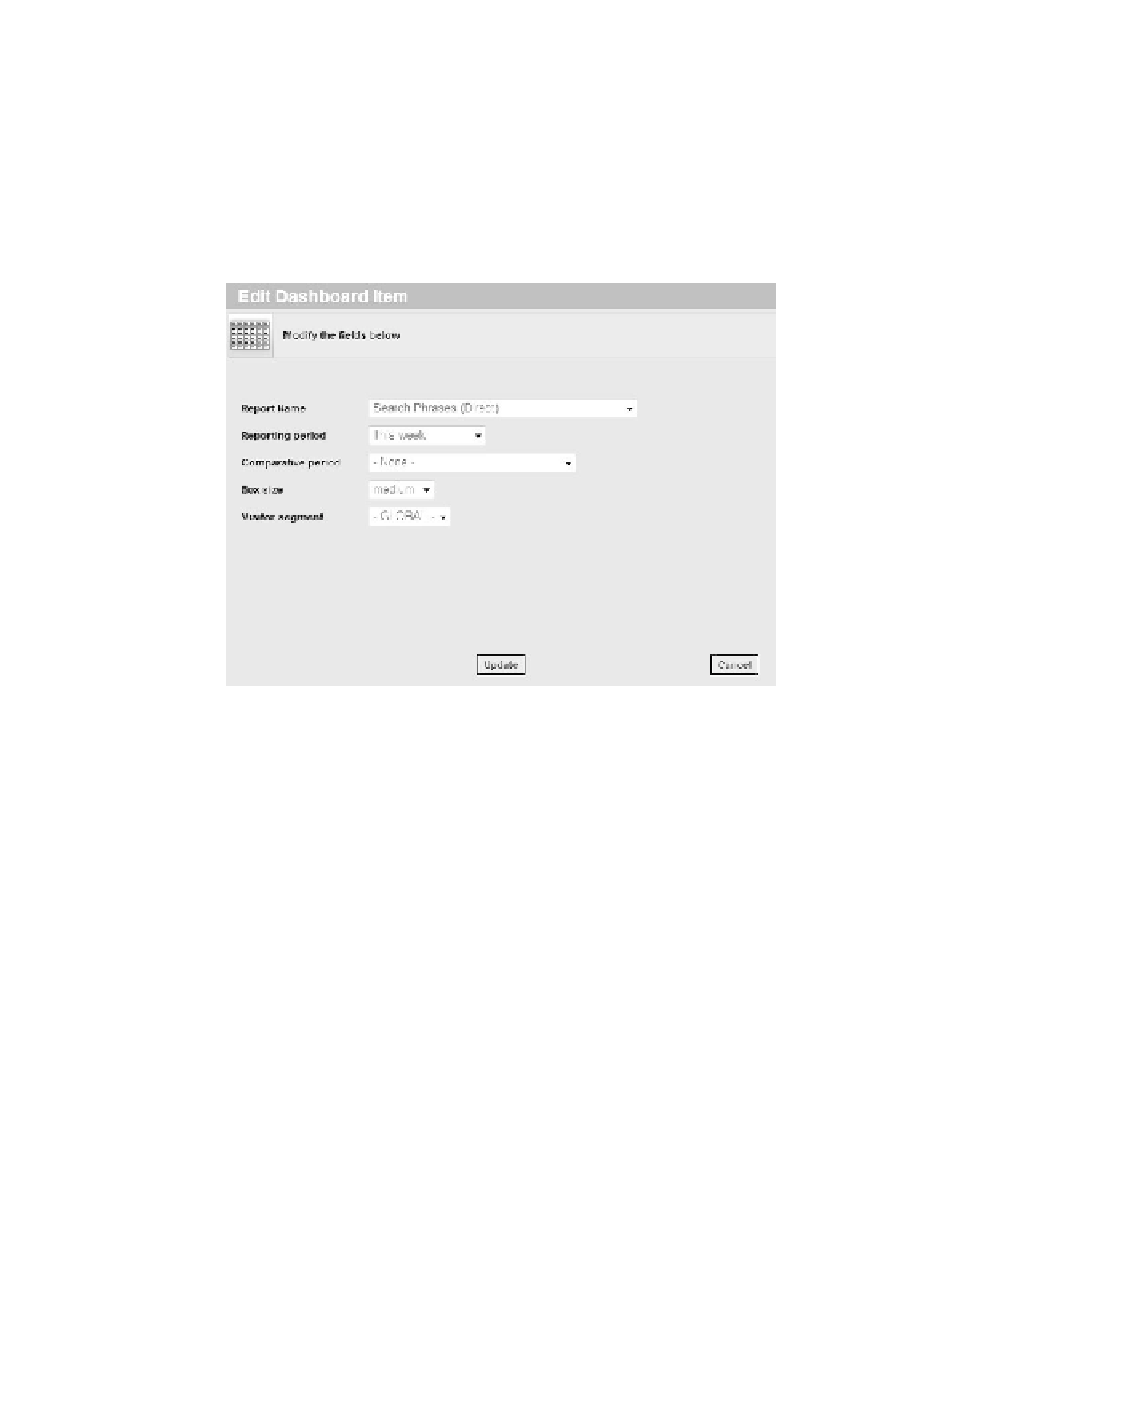
the add Dashboard item screen shown in Figure 9.11, but with a few added attributes
(see Figure 9.13).
234
Figure 9.13
We've added a few attributes to this screen.
The Full report function will take you to a report showing an in-depth view of
the data and will allow you to work with it in greater detail—which is exactly why you
should use a dashboard: Whenever you spot something out of the ordinary, you must
drill into the data and figure out why that is. The full report for the item in Figure 9.12
looks like Figure 9.14.
notice that the rolling period from the dashboard, This Week, is replaced with
the actual date range in the full report.
You can move the whole item to another position on the dashboard simply
by clicking the header, dragging the item to another position, and then releasing the
mouse button.
These general functions are applied to all dashboard items. i will not repeat
these descriptions as we move along to other kinds of visualizations.
i tend to use Tabular Data only when it comes from custom reports, but
when utilized correctly, Tabular Data can be quite powerful. an example is the
custom report we created earlier, the search engine revenue insight and referrals
report.


