Information Technology Reference
In-Depth Information
Yet again, we are provided with instant insight, such as another outlier not mak-
ing any revenue (in this example, Kiev). even more important is the fact that the most
costly city, from a campaign point of view, drives very little revenue.
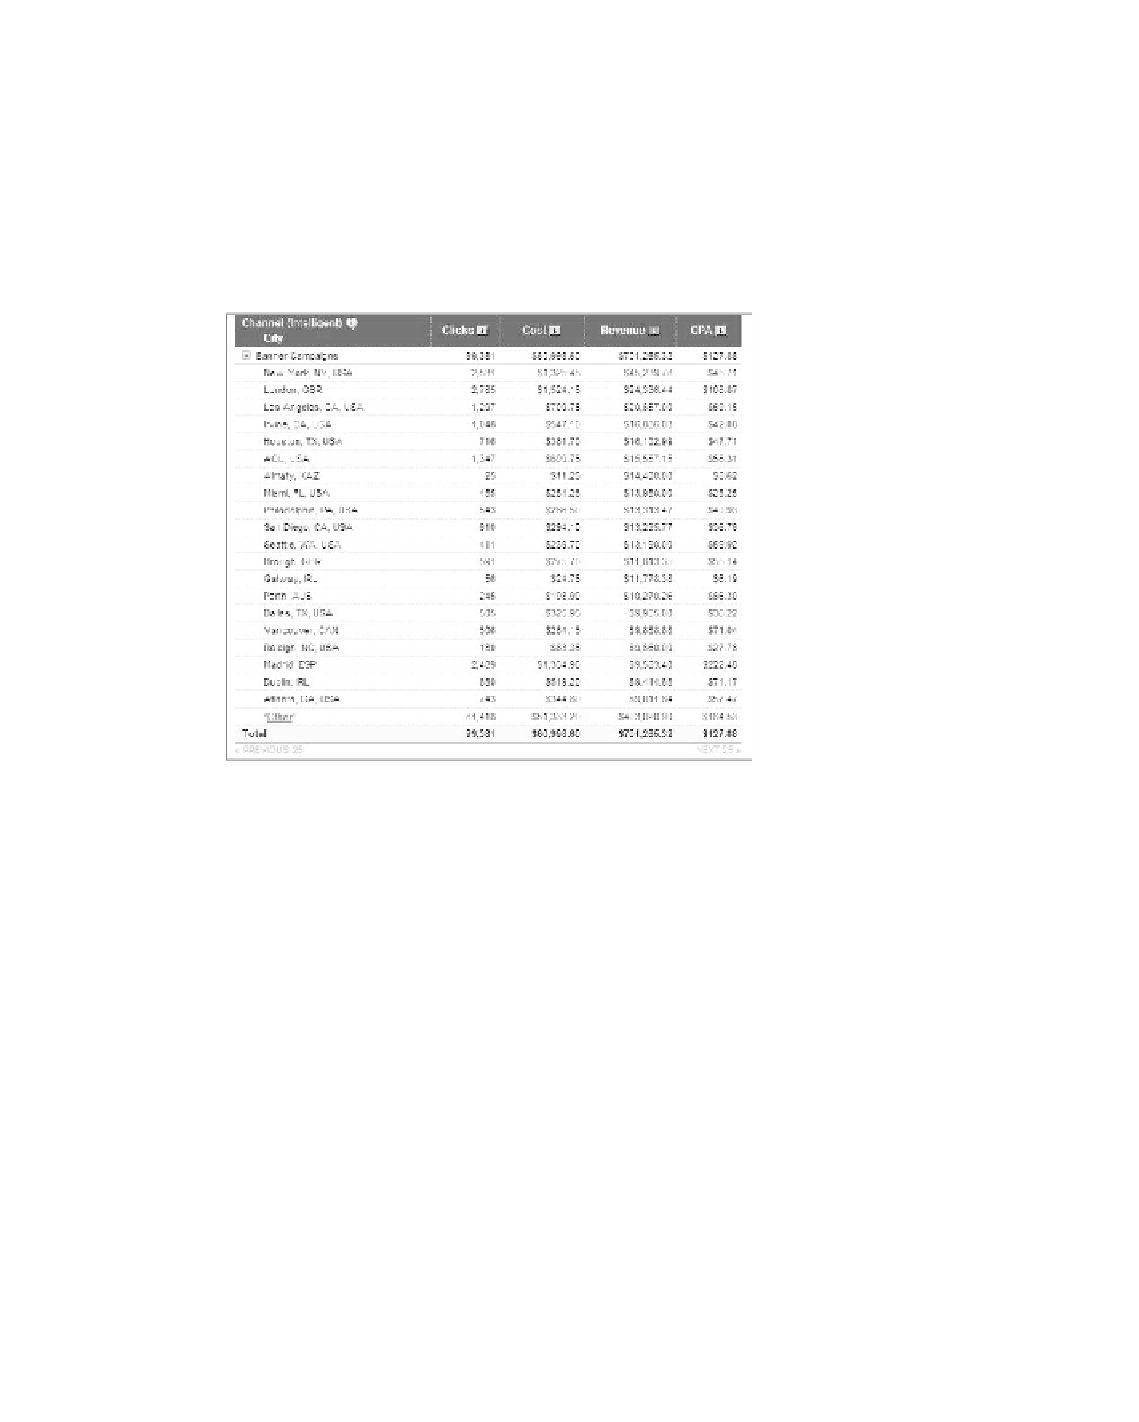
i finally chose to sort the report by revenue to get yet another view of this par-
ticular channel (see figure 8.16). as with the previous reports, i sorted with my cpa
in mind.
206
Figure 8.16
Adding a demographic dimension and sorting by revenue
With this report you bring irvine into the picture again—it was lost at the bot-
tom of the previous reports—but more importantly, Houston is brought in near the
top and appeared out of nowhere. there might be a great optimization opportunity to
pursue here.
all of the reports heavily depend on the attribution model chosen, but that just
makes it ever more valuable to play with. You can see from the figures that intelligent
attribution was applied.
if this isn't just absolutely beautiful, then i do not know what is. and this is just
one dimension (a unique campaign channel) and one demographic dimension (city)
that is paired. there are literally hundreds of other reports that you can pair, and then
again, reports where you can go beyond just two dimensions.
Yahoo! derives its demographic information through ip lookup, which is not
100 percent accurate. in some narrow dimensions, ip lookup is close to 80-85 percent
accurate. this does not mean you cannot trust the data—it just means that you should
ensure you are looking at enough data. it also means that you will see discrepancies
(for example, aol is a city in the United Kingdom as well as america online).