Information Technology Reference
In-Depth Information
180
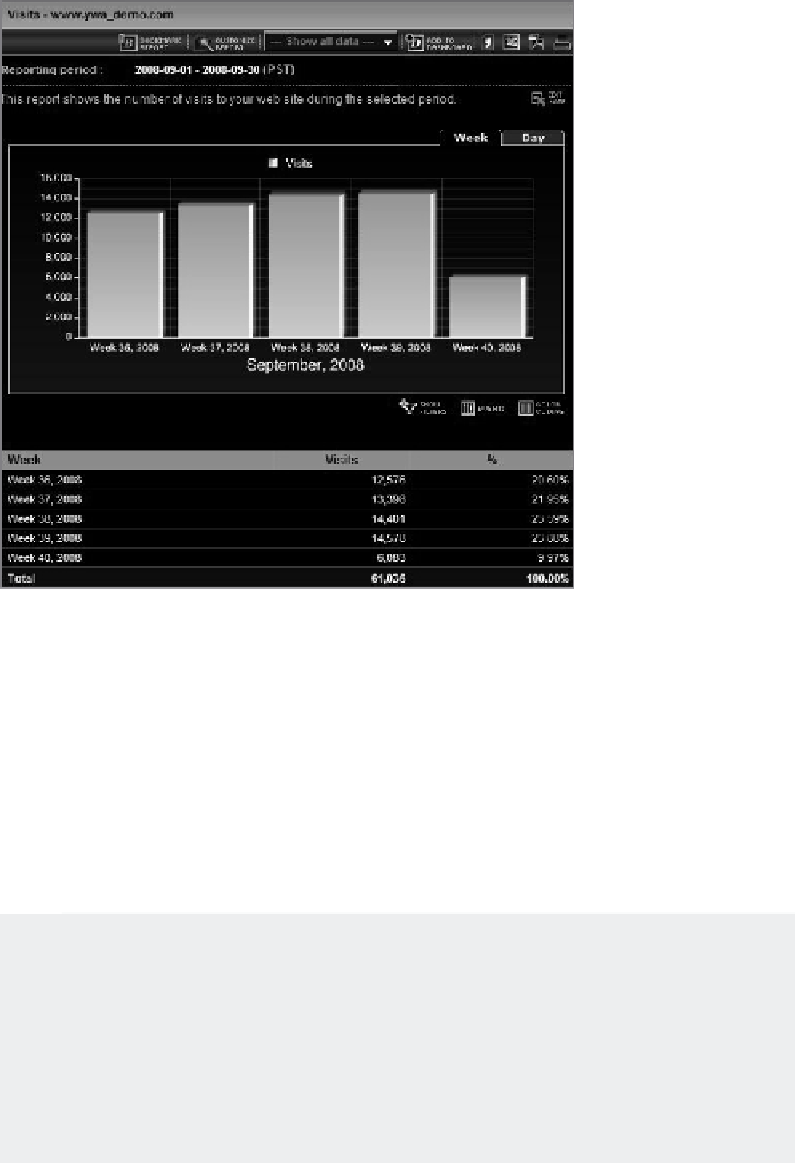
Figure 7.18
Visits report
suppose we want to know if increased traffic over the last weeks increased our
revenue. to answer this question and to initiate an investigation, we should customize
this report instead of hunting for a unique revenue visits report.
Clicking the Customize Report button at the top of the wizard screen opens
the screen shown in Figure 7.19, which resembles a traditional pivot table and visually
shows how the report was built so that you can continue from there. the table head-
ers Visits and Visits % in the background resemble how the final report will look. the
data under each of these headers is dynamically updated as you change the report.
Pivot Table
A pivot table is a data summarization feature found in data management and visualization appli-
cations, such as a spreadsheet like Microsoft Excel. Among other functions, this feature lets you
automatically sort, count, and total the data stored in one table or spreadsheet and create a sec-
ond table displaying the summarized data. Pivot tables are useful for quickly creating cross tabs.
The user sets up and changes the summary's structure by dragging and dropping fields graphi-
cally. This “rotation,” or pivoting of the summary table, gives the concept its name.