Agriculture Reference
In-Depth Information
Table 9.1
Kinetic parameters of PLD toward
dipalmitoylphosphatidylcholine
Mitochondrial PLD
Microsomal PLD
V
max
(nmol/mg protein min)
3.75
44.44
K
m
(
μ
M)
114
277
V
max
/
K
m
0.033
0.160
Mitochondrial membrane
350
Microsomal membrane
300
250
200
150
100
50
0
0
100
200
300
400
500
600
Substrate concentration ( M)
0.12
0.1
y
= 2.0255
x
+ 0.0178
0.08
Mitochondrial membrane
0.06
Microsomal membrane
0.04
y
= 0.415
x
+ 0.0015
0.02
0
0.0000
0.0100
0.0200
0.0300
0.0400
0.0500
1/[PC]
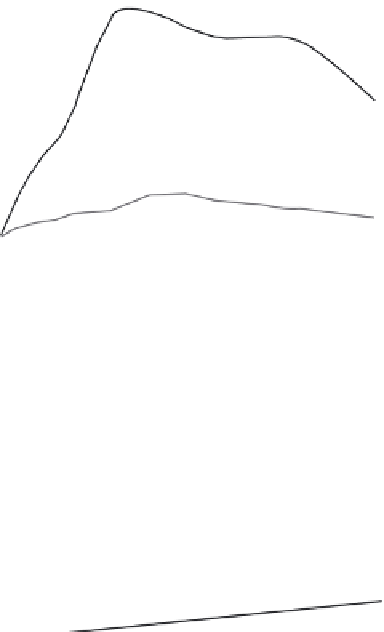
Fig. 9.7
Substrate-velocity plot (top panel) of PLD activity in mitochondrial and microsomal membrane fractions
of strawberry fruit. Phospholipase D activity was measured by the release of radiolabeled choline from 16:0/16:0
phosphatidylcholine (L
3
-phosphatidyl (
N
-methyl-
3
H) choline, 1,2-dipalmitoyl) in a 1-mL reaction mixture result-
ing from a 15-min reaction period. The substrate was prepared by mixing cold PC and radiolabeled PC in a ratio
of 1 nmol/3.7 kBq, also containing 0.1% Triton x-100 and 50-mM Hepes, pH 7.0 (final). Appropriate volumes
of the substrate were added to the reaction mixtures to give the desired concentrations. A separate blank without
the enzyme was made for each concentration of the substrate used to correct for the enzyme activity. The values
are mean
SE from three separate experiments. Lineweaver-Burk plot of the data is given in the bottom panel
without taking the plateau region. (Reproduced with permission from Yuan et al., 2005.)
±


Search WWH ::

Custom Search