Biomedical Engineering Reference
In-Depth Information
and process zone. Equation
(3.5)
also shows
that: (i) staggered arrangement amplifies the
toughness of interfaces, (ii) increasing the aspect
ratio positively affects the toughness, and (iii)
composites made of stiff inclusions and soft
interfaces have enhanced toughness (term
E/τ
s
)
[29]
. These models for stiffness, strength, and
toughness can greatly help the designers choose
the best materials and microstructural parame-
ters in order to tailor and optimize the perfor-
mance of biomimetic staggered composites.
3.2.4 Strain Hardening at the Interfaces
The foregoing models show the effects of shear
strength and shear modulus of interfaces on the
behavior of staggered composites. However, in
natural composites like nacre, the shear strength
of the interfaces is not constant and increases
with increases in shear strain. This strain hard-
ening at the interfaces causes progressive tablet
sliding (
Figure 3.6
a), which is one of the most
important deformation mechanisms of biologi-
cal hard materials like nacre and is the origin
of toughening mechanisms such as viscoelastic
energy dissipation at process zone.
Progressive sliding prevents strain localiza-
tion and spreads the deformation through large
volumes of material, thereby providing high
levels of strain and therefore improving the
energy absorption properties of the material
(because this energy is the area under the stress-
strain curve).
Figures 3.6
b and c show how
the incorporation of wavy tablets improves the
load transfer
[14]
. In the case of flat tablets, the
load is transferred between the tablets only by
shear stresses. For wavy tablets, tablet sliding
generates transverse tensile and compression
stresses, which contribute to the load transfer,
increase the resistance over sliding, and gener-
ate hardening. The organic material itself gener-
ates hardening if the shear resistance of organic
material increases with shear strain. The choice
of organic material is therefore crucial for
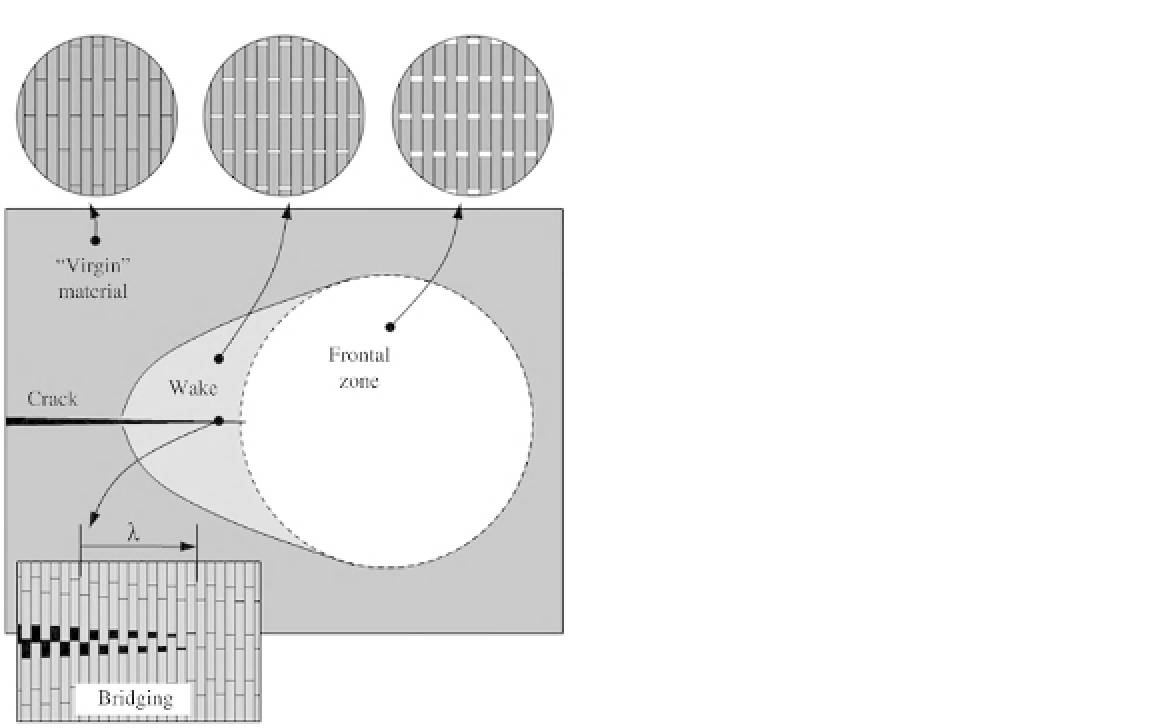
FIGURE 3.5
Schematic of a crack advancing in a stag-
gered composite, where
λ
represents the bridging length and
a
represents the crack advance. Adapted from Ref.
30
.
of bridging and process zone can then be esti-
mated for the steady-state case; thus
[29]
ρ
2. 5
−
(
U
MAX
/
L
)(1
/
ρ)(
E
/
τ
S
)
J
I
,
J
=
(3.5)
where
J
is the mode-I fracture toughness of the
composite,
U
max
is the maximum cohesive dis-
placement as depicted in
Figure 3.4
, and
J
i
is the
toughness of the interface. In this model,
debonding is assumed to happen after the ulti-
mate shear strain of the organic material at the
interface is exceeded. The
ultimate shear strain
is
the maximum shear strain that the organic mate-
rial at interfaces can withstand.
The values for toughness predicted by this
model were found to be in good agreement with
experimental values for red-abalone nacre
[29]
.
This shows that the toughness of nacre can be
analytically explained by the effect of bridging