Biomedical Engineering Reference
In-Depth Information
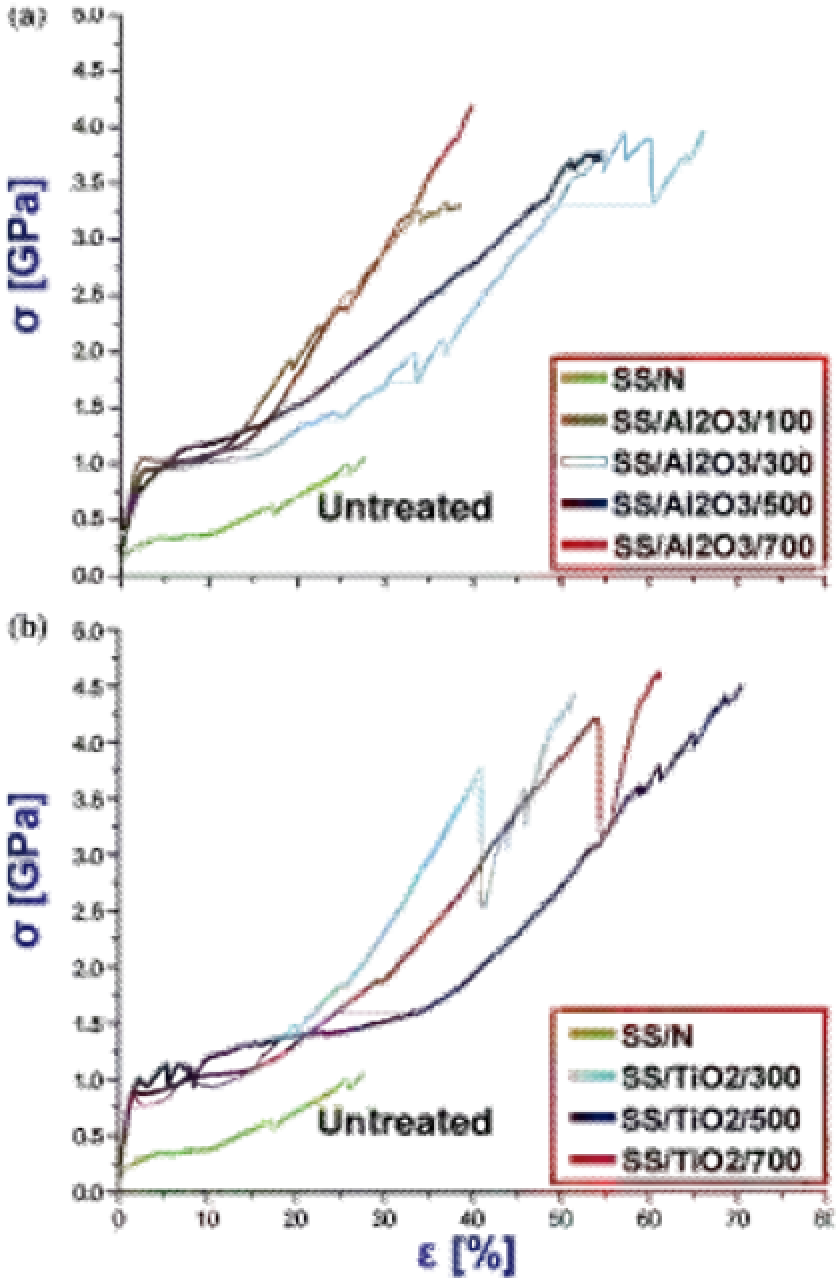
FIGURE 16.10
Tensile test curves of silk fiber samples treated by TMA/H
2
O and TIP/H
2
O precursor pairs and com-
parison to untreated samples and samples treated with various numbers of cycles. (a, b) Stress (
σ
) and strain (
ε
) curves of
silk fibers treated with TMA/H
2
O and TIP/H
2
O pulse pairs with various numbers of cycles ranging from 100 to 700.
Reprinted from Ref.
111
. Copyright © 2009, with permission from the American Association for the Advancement of Science.