Biomedical Engineering Reference
In-Depth Information
can be deduced and ways of quantifying this
response be devised. Related examples include
measurement of cell attachment and prolifera-
tion kinetics
[56, 135]
; measurement of protein
adsorption from artificial tear fluid onto contact
lens materials
[136-141]
; and the potential of
materials to activate blood plasma coagulation
can be assessed using plasma coagulation meth-
ods
[28, 81]
.
8.4.4 Interpreting the Data
Because surface-analytical methods are seldom
ideal in the sense of the intersection of
Figure
8.6
, a means of utilizing analytical information
that may only be indirectly related to the bio-
logical response to materials must be found.
This situation is hardly unique in science
because, in general, reality is so complex that
we can measure only certain aspects of the
phenomenon under study. Relationships
among the intensity of the phenomenon (the
dependent parameter or response) and varia-
bles under experimental control (the inde-
pendent parameters or dose) are inferred by
plotting dose-response on Cartesian coordi-
nates. A cause-and-effect relationship between
dose and response is then inferred from a cur-
vilinear interpolation between authentic data
points or lack of cause and effect is suggested
if no such interpolation is apparent.
Effectively, these inferred dose-response rela-
tionships are a kind of calibration curve.
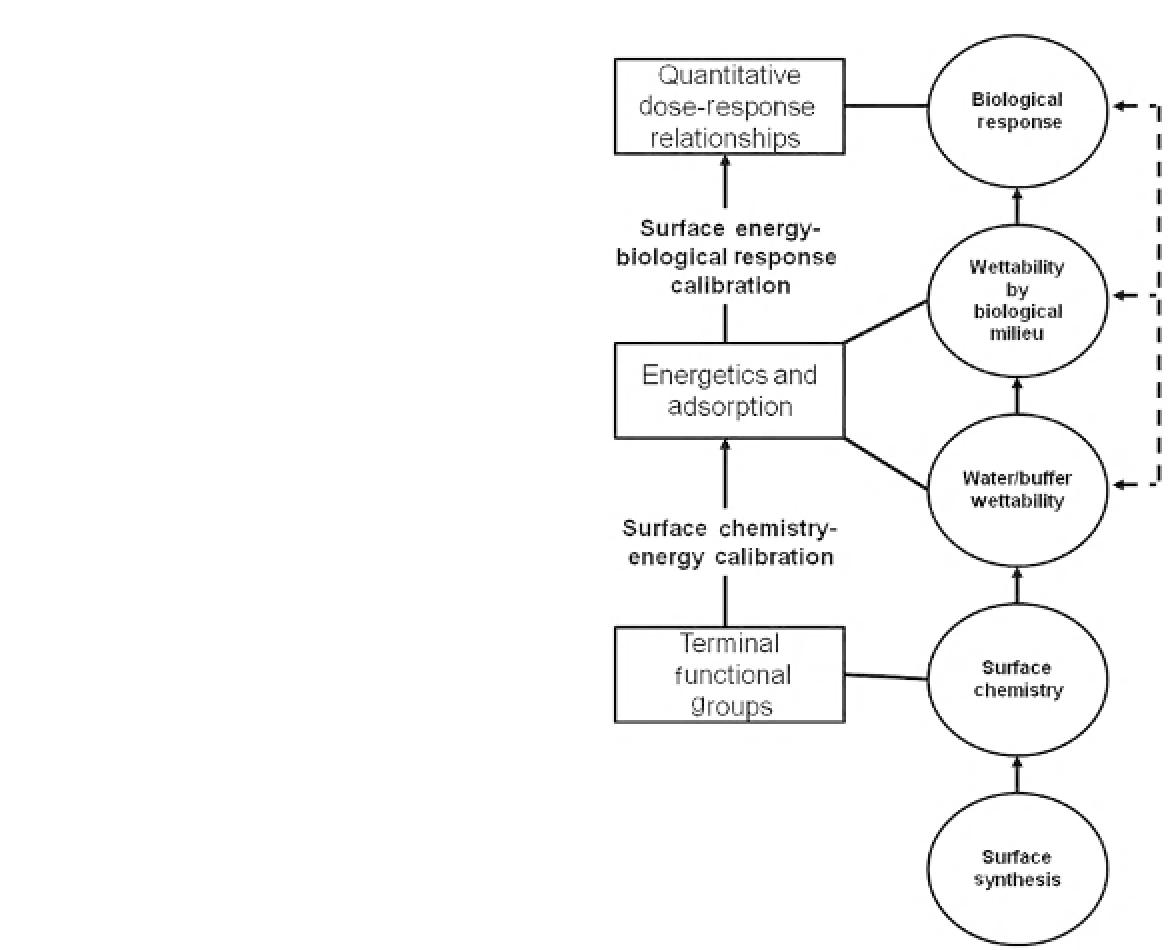
Figure 8.7
diagrams two complementary levels
of calibration that relate surface characteristics
(Section
8.4.2
) to a quantitative measure of the
biological response (Section
8.4.3
). For example,
a measure of cell adhesion might be plotted
against water/buffer wettability of the substra-
tum surface to which cells attach
[26, 55]
.
Substratum surface energy can be incremen-
tally varied by methods suggested in Section
8.4.1
and the number of cells attached to this surface
measured according to some protocol
[56, 135]
.
As long as the substratum exhibits a particular
FIGURE 8.7
A data interpretation scheme that relates the
biological response to materials to surface chemistry and
energy. Surface synthesis (engineering and modification)
creates a surface chemistry that can be quantified by one of
a number of surface analytical methods measuring terminal
functional group chemistry. Surface composition is not
directly connected to the biological response but rather
influences surface energetics that are responsible for the
adhesion and adsorption events underlying the biological
response to materials (see
Figures 8.3 and 8.4
). A surface
chemistry-energy calibration quantifies these connections,
which, in turn, can be related to quantified measures of the
biological response to materials from which dose-response
(cause and effect) can be inferred.
level of water wetting, it can be expected that
cells will adhere to the extent indicated by a
calibration curve plotting cell adhesion against

