Biomedical Engineering Reference
In-Depth Information
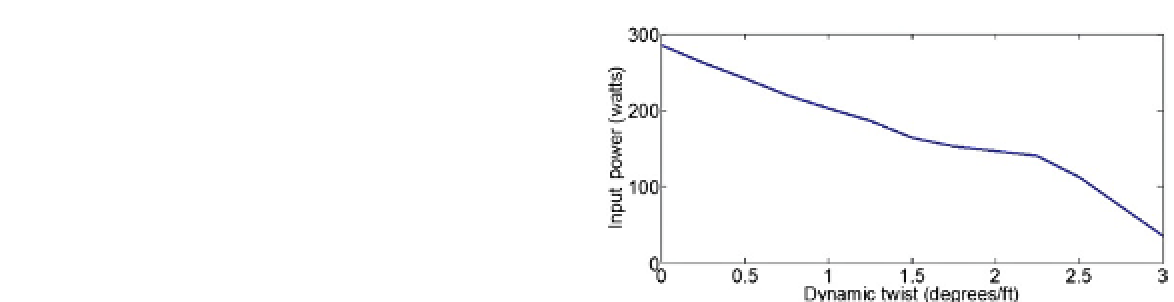
FIGURE 5.25
Input power as a function of dynamic
twist.
less effort is needed to keep flapping. This means
that with an increase in dynamic twist, more
energy can be drawn from the airflow to produce
thrust.
The variation of total lift and total thrust pro-
duced by the wing over a flapping cycle is
shown in
Figure 5.26
a and b for a fixed dynamic
twist amplitude of
β
0
=
2.25°/ft. It is seen that the
lift and drag have an approximately sinusoidal
variation with flapping cycle angle. In the down
stroke (cycle angle varying from 0° to 180°), the
average lift and thrust produced per wing are
high. In the up stroke (cycle angle varying from
180° to 360°), the lift produced is low and the
thrust produced is negative. However, positive
lift and thrust are produced over the entire cycle.
Refined structural models of flapping-wing
flight include higher-order twist deformation in
addition to bending deformations. In the case of
insect wings having a lower aspect ratio, plate
theories may be necessary to capture the appro-
priate dynamics. Nonlinearities may be intro-
duced in terms of kinematic couplings or large
deformations. Refined aerodynamic analyses
rely on purely computational techniques to cap-
ture the complex, three-dimensional, unsteady
flowfield. Larijani and DeLaurier
[85]
developed
a nonlinear aeroelastic analysis to further inves-
tigate the aerodynamical and structural dynami-
cal features of ornithopter flight. This analysis
included a finite element structural model with
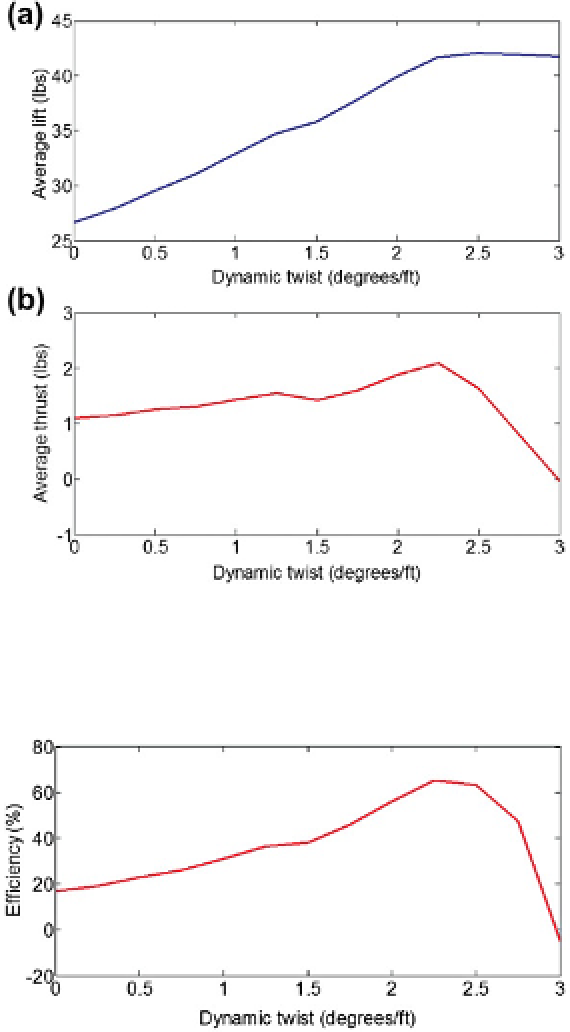
FIGURE 5.23
Average lift and average thrust produced
over one flapping cycle as a function of dynamic twist
amplitude. (a) Average lift and (b) average thrust.
FIGURE 5.24
Propulsive efficiency as a function of
dynamic twist.
efficiency of modern propellers (70-80%). This
is because the inherent mechanism of flapping
consists of phases when lift and thrust are lost
(during the down stroke) and the thrust gener-
ated is not constant over the flapping cycle.
The average input power,
P
in
(
Figure 5.25
) is
also plotted against the dynamic twist angle. It is
seen that with increase in dynamic twist, the input
power required becomes lower and considerably