Graphics Reference
In-Depth Information
in an image's shadows, highlights, and color channels, it's possible to bring that infor-
mation out, improving and preserving the artwork's details.
Briefly, an image's
tonal value
is its range from darkest to lightest areas. Many
images that seem to have multiple problems really just need a tonal value adjustment.
Tonal problems respond best to a software program that generates histograms.
Linear sliders for brightness and contrast, like those in consumer programs, will not
do the trick. Professional editing programs (still and video) offer histograms and level
tools, as well as brightness and contrast sliders. Some programs also offer other tools,
like Photoshop's Curves or Adobe After Effects' Levels and Channels. You're free to
experiment with any of these options to find the ones that feel most intuitive to you.
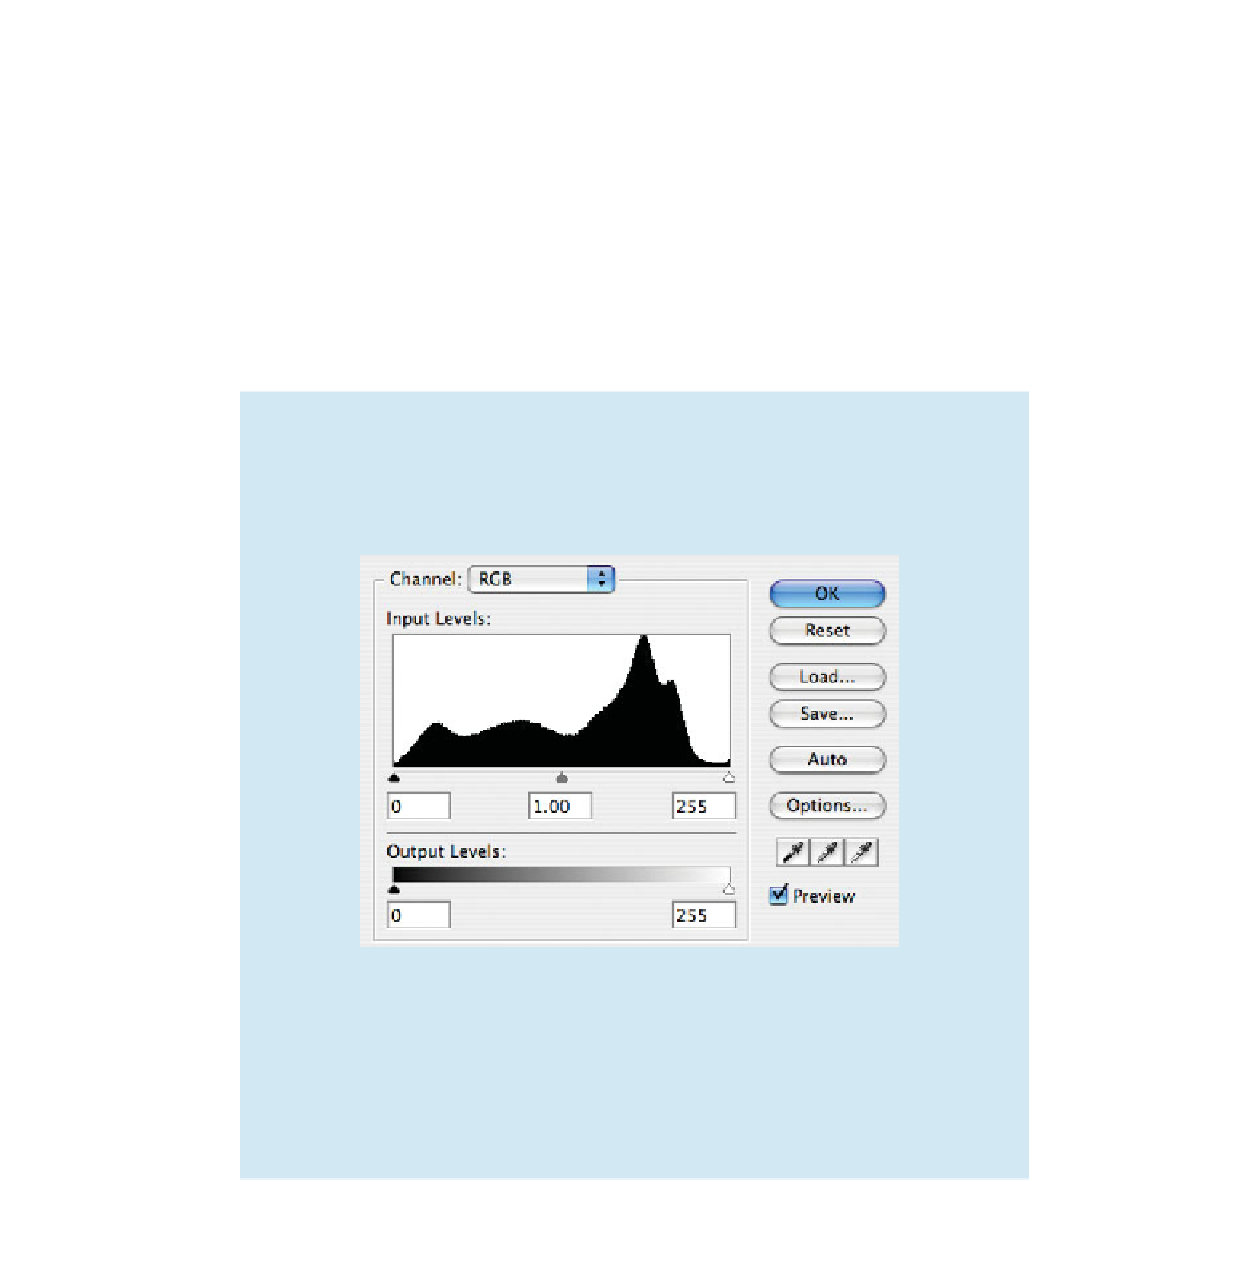
What is a histogram?
A histogram is a chart of thin vertical lines that shows the distribution of brightness in an
image, from 0 (black) to 255 (white). The taller the line, the more pixels the image has at
that level of brightness. Darkest pixels are on the left, and brightest on the right.
input slider
white
point
dropper
output slider
The input sliders regulate the distribution of brightness. The output sliders regulate how
much contrast the image has. There are three small eyedropper boxes on the lower right.
The one on the far right sets the white point, which is the brightest place on your image—
pure white. The one on the far left sets the black point, the place of deepest shadow. Used
together by clicking the whitest and darkest image areas, they treat an image's value range
like a rubber band, stretching it out in both directions to use the entire value range.