Geography Reference
In-Depth Information
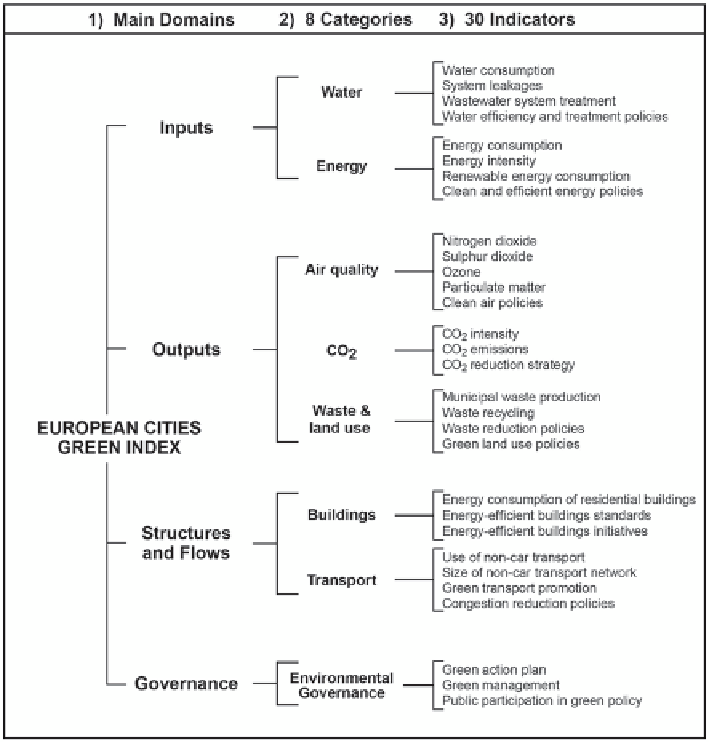
Fig. 5.2
Composition of the Green City Index for European cities. (Source: Re-arranged from The
Green City Index: Economist Intelligence Unit
2012
)
by the indicators, whereas Kiev is the bottom of the scale with 32.3 (Fig.
5.3
). One
of the striking features of plotting the scores on a map is the way it shows how the
cities of the former communist countries of Eastern Europe rank far lower than
those of the rest of Europe, although most of the cities of southern Europe also have
relatively low scores. Theoretical isopleth lines are added to the map just to draw
attention to this pattern. They also show that the large cites of Scandinavia and the
Netherlands, as well as those in Switzerland and Austria have uniformly high scores,
indicating relatively high levels of sustainability. This is a consequence of the fact
that these mainly northern centres embraced sustainable principles at an earlier time
than others and with more rigour. The lower values for Eastern European centres is
a result of their heritage of development under communist totalitarian regimes that
often ignored environmental problems and where criticism of these practices was