Geoscience Reference
In-Depth Information
30%
25%
20%
15%
10%
5%
0%
0
100
200
300
400
500
Temperature, °F
Kestin et al. (1977)
Kestin et al. (1978)
Kestin-Shankland (1984)
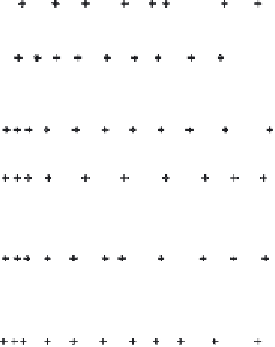
Fig. 4-20. Distribution of data points in the brine viscosity database, salinity vs. temperature
Figure 4-20 shows the distribution of data in the database of brine
viscosity by salinity and temperature. Note the limited number of brine
measurements at higher temperatures. Each symbol in figure 4-20 may
represent multiple measurements at the same salinity and temperature,
but different pressures. Thus, figure 4-20 appears to show fewer data
points than figures 4-19 and 4-21.
Figure 4-21 shows the distribution of data in the database of brine
viscosity by pressure and salinity. There appears to be a relatively
uniform distribution of data over pressure and salinity.


Search WWH ::

Custom Search