Geoscience Reference
In-Depth Information
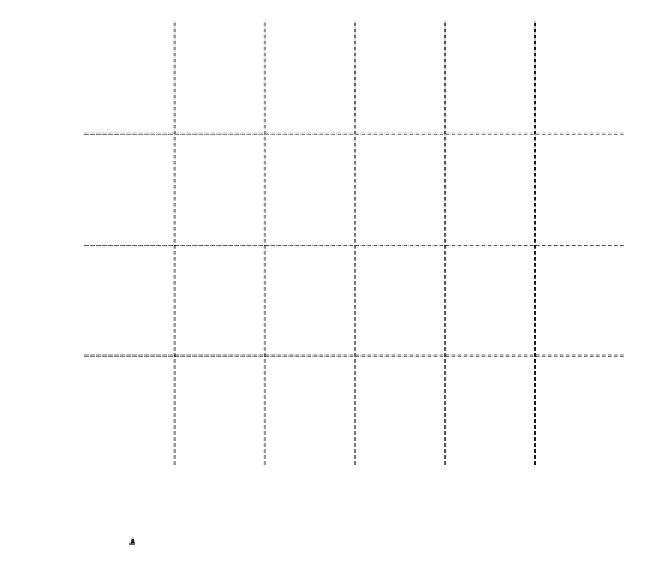
Figure 4-9 shows the distribution of data points in the brine
compressibility database by pressure and salinity. The database has good
coverage over the range of salinities from 0 to 25 wt% sodium chloride,
but the coverage in pressure is limited.
100000
10000
1000
100
10
0%
5%
10%
15%
20%
25%
30%
Salinity, weight % NaCl
Freyer (1931)
Gibson-Loeffler (1949)
Rowe-Chou (1970)
Fig. 4-9. Distribution of data points in the brine compressibility database, pressure vs. salinity


Search WWH ::

Custom Search