Geoscience Reference
In-Depth Information
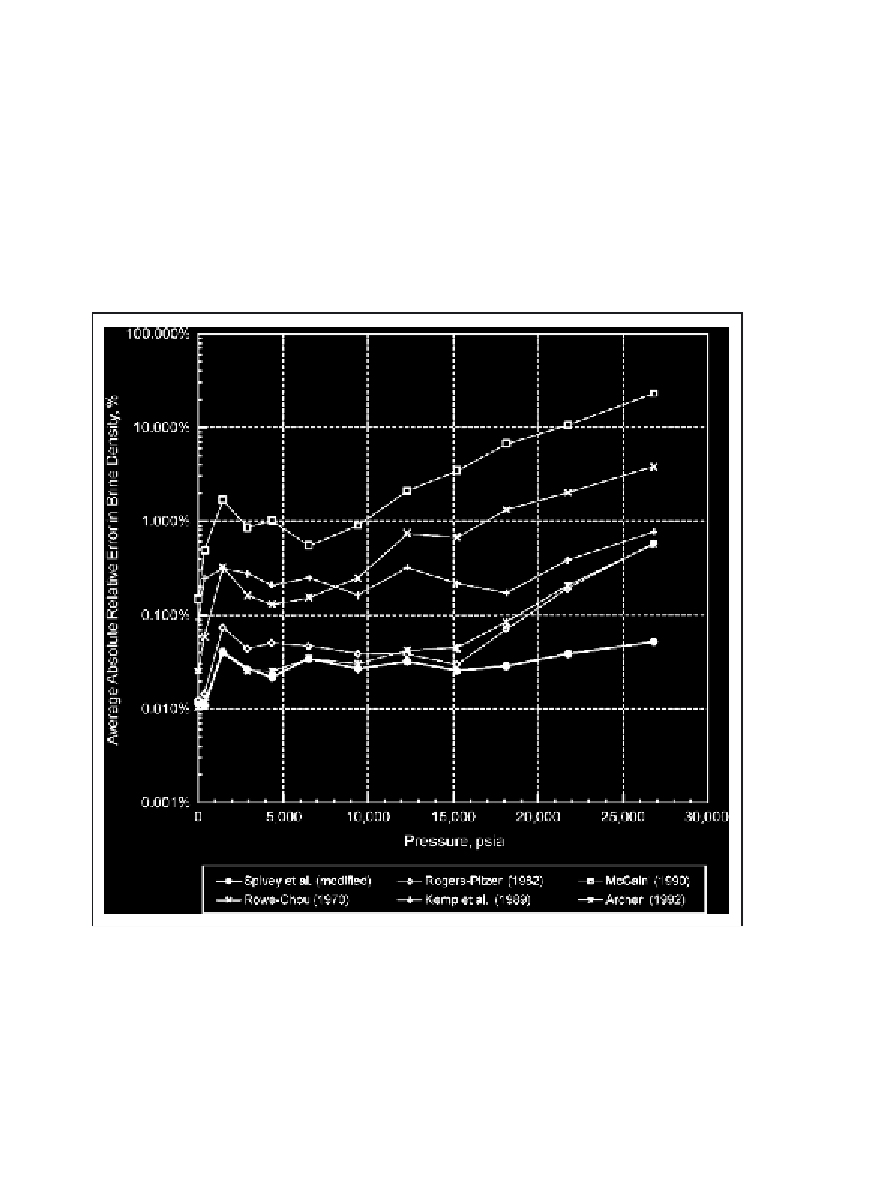
correlations varies by as much as a factor of 100, the AARE is shown on
a logarithmic scale, and the average relative error (ARE) is not shown.
The modified Spivey et al. correlation performs as well as or better than
the other correlations throughout the range of temperatures in the
database. Below 302ºF (150ºC), the Rogers-Pitzer and Archer equations
of state perform almost as well as the modified Spivey et al. correlation.
Above 302ºF (150ºC), the modified Spivey et al. correlation performs
significantly better than either the Rogers-Pitzer or the Archer equation
of state.
Fig. 4-5. Average absolute relative error in brine density as a function of pressure for various
correlations, based on the brine density database in table 4-1
Figure 4-5 shows the AARE in brine density as a function of pressure
for data in the brine density database in table 4-1. Again, the modified
Spivey et al. correlation performs as well as or better than any of the other


Search WWH ::

Custom Search