Biomedical Engineering Reference
In-Depth Information
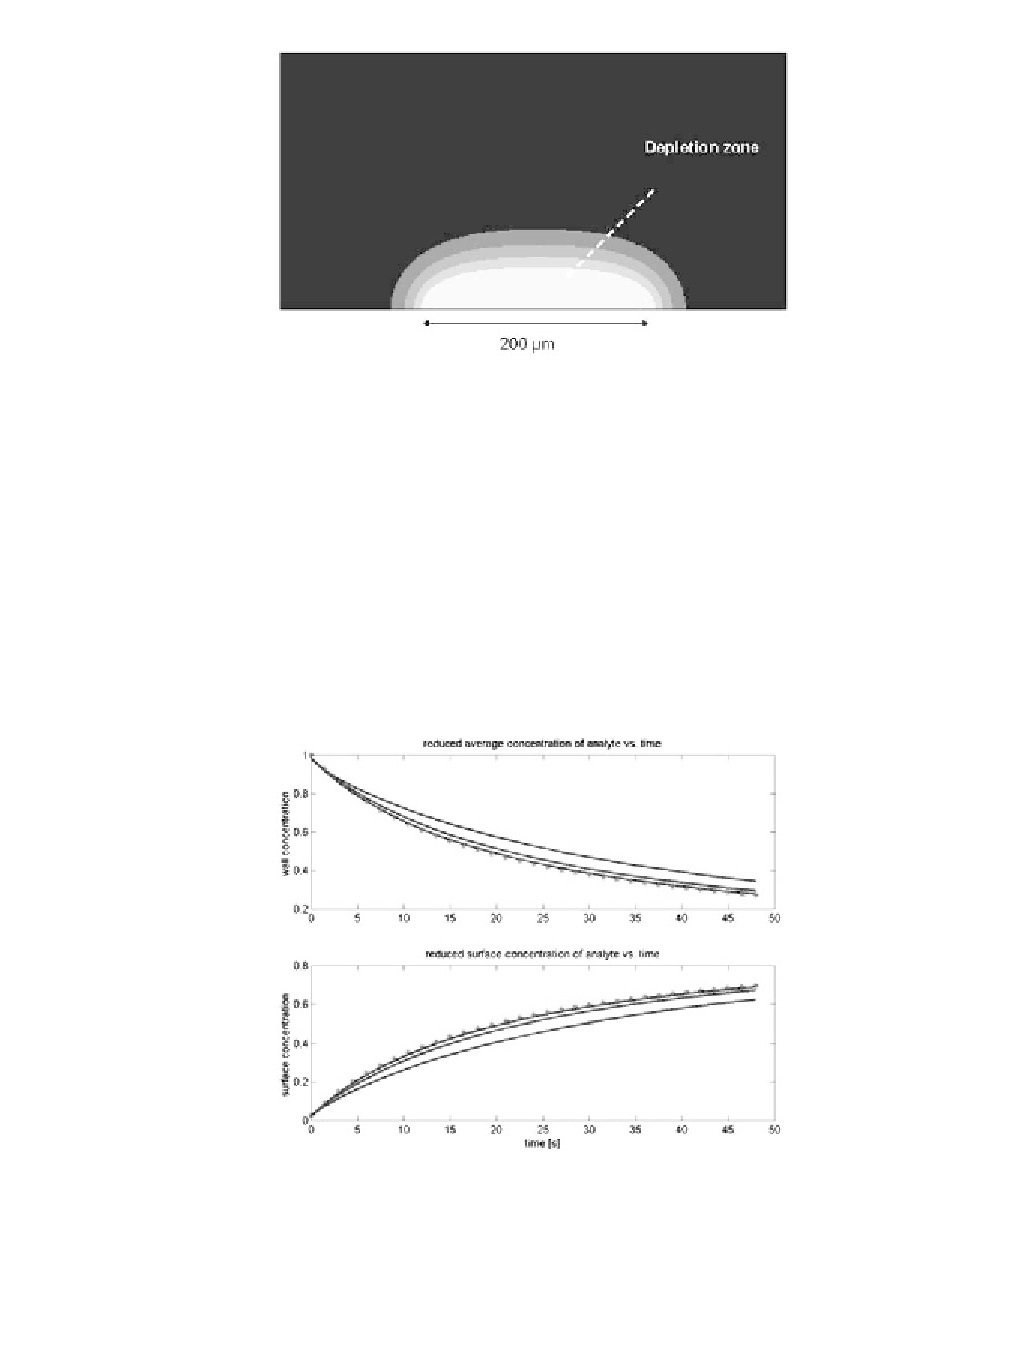
Figure 7.40
Concentration depletion in the case of a diffusion limited reaction. Caution: the repre-
sentation is not to scale, the vertical axis has been extended for visualization.
When the reaction is diffusion limited, a region of concentration depletion
forms at the vicinity of the reactive surface.
Figure 7.40 shows a contour plot of the
concentration in such a case.
If the reaction were not diffusion-limited, the Langmuir kinetics would be the
right one. If the reaction is diffusion-limited, the kinetics curves depart from that of
the Langmuir model (
Figure 7.41).
The numeric model may be used to predict the reaction parameters. They can
be adjusted to fit the experimental results (
Figure 7.42).
Figure 7.41
(a) Average concentration of analyte at the wall (c
p
/c
bulk
) versus time. The dotted
line is the Langmuir solution (kinetics limited only by the biochemical reaction). The three lines cor-
respond respectively to
D
= 10
-
11
, 3. 10
-
11
and 10
-
10
m
2
/s, and to the three Dammkoehler numbers
1/2, 1/0.66, and 1/0.2. (b) Same as (a) but for the surface concentration of hybridized sites (
G/ G
0
)
versus time. Note that the Langmuir solution does not depend on
D
.