Biomedical Engineering Reference
In-Depth Information
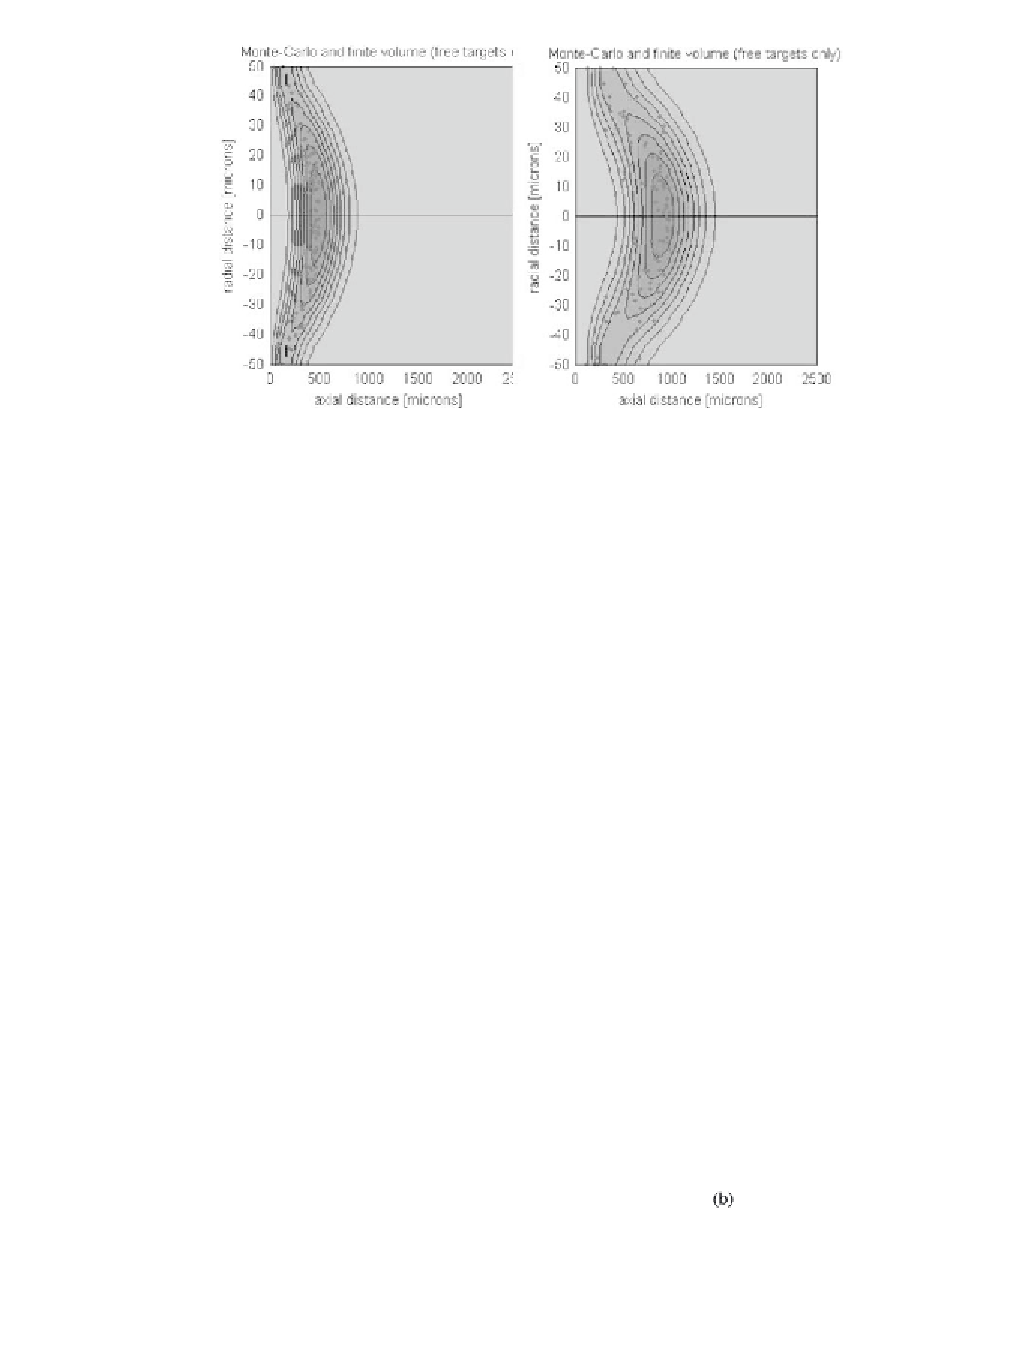
Figure 6.45
Comparison of the concentration contour lines (from Figure 6.21) with the results of
the Monte Carlo simulation. Radius
R
= 50
m
m, diffusion coefficient
D
= 2
×
10
-
10
m
2
/s and average
velocity
V
= 500
m
m/s.
When the liquid flow is initiated, the solute zone is carried downstream at a rate
depending on the particle size and mass.
Figure 6.52 shows a correct separation when the immobilized particles form
two peaks completely disjointed.
In Chapter 9, an example of magnetic FFF is given, with the calculation of tra-
jectories inside the channel.
6.4.2 Chromatography Columns
Chromatography is a separation technique mostly employed in chemical and bio-
chemical analysis [19, 20]. In a single-step process, it can separate a mixture (buffer
fluid carrying different types of bioparticles) into its individual components and
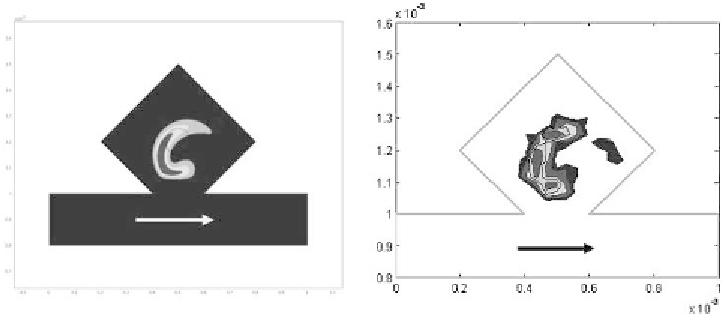
Figure 6.46
(a) COMSOL multiphysics model of a bolus of concentration in a recirculating flow.
(b) Same calculation with the BRW method (1,000 particles).