Biomedical Engineering Reference
In-Depth Information
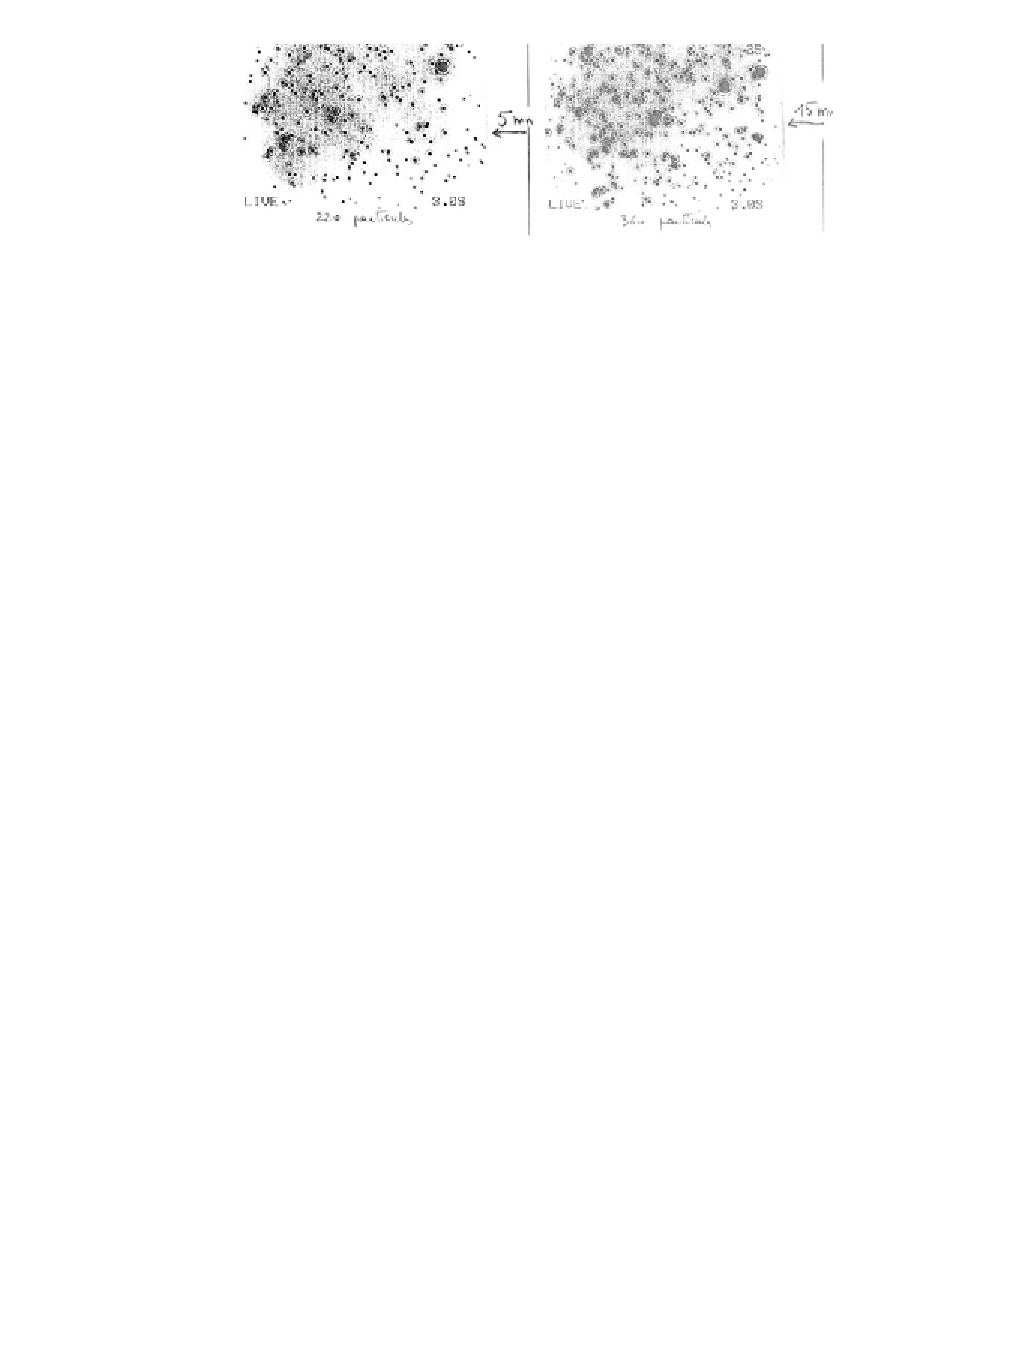
Figure 5.8
Photographs of the upper plate taken under the microscope at 5 mn and 15 mn.
æ
2
2
ö
c
1
c
c
c
(5.23)
=
div Dgradc D
(
)
=
+
+
ç
÷
2
2
t
r
r
r
z
è
ø
In this particular case, we can express the concentration in particles per unit
volume, and the mass flux at the wall
J
is then expressed in particles per seconds
per unit surface. The mass flux at each wall (defined by
z
= 0 and
z
=
e
) is given by
Fick's law
c
c
(5.24)
J
=
J
+
J
= -
D
+
D
upper
lower
z e
=
z
=
0
z
z
If we suppose that the radial dimension
R
of the drop is large in front of the distance
between the plates
e
, we can approach (5.23) by the one-dimensional equation
2
c
c
=
div Dgradc D
(
)
=
(5.25)
2
t
z
A first approach to the problem consists in solving (5.25) for times less than
2
( 2)
4
e
. For these times, the depletion of the concentration has not reached the
center plane of the drop. The problem is then similar to that of Ilkovic for each
plate, and the solution of (5.24) is
τ
=
D
D
(5.26)
J
=
2
c
0
π
t
This solution breaks down when the concentration at the center plane starts de-
2
( 2)
4
e
creasing from its initial value
c
0
. So when time is larger than
τ
=
, Ilkovic's
solution is no longer valid. In Figure 5.9, we compare the experimental results
(dots) to the Ilkovic's solution and to the results of a simple 1D numerical scheme
(finite differences method).
Vertical concentration profiles at different times—obtained by the numerical
method—are plotted in Figure 5.10. At the beginning, the profile is still flat at the
center with a concentration
c
0
. At times
t
larger than
t
, the concentration at the
center plane decreases below the value
c
0
.
D