Biomedical Engineering Reference
In-Depth Information
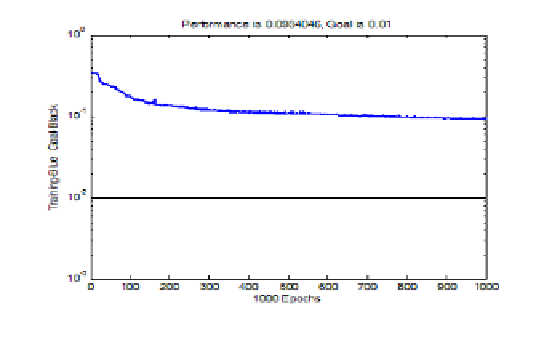
Fig. 4. Network Performance over Epochs.
has learned the “right” survival pattern of lung cancer patients.
At first, we generate the data for each column randomly and uniformly
distributed in the domain. For example, the domain for
column is the
closed interval [1
,
4]. All numbers are rounded to integers. After a Cox
regression analysis, the computation cannot be converged. This result shows
that randomly generated data is not acceptable. The covariates for lung
cancer patients must be distributed with a certain pattern.
Recall the Cox regression results for original hospital data. The mean
and standard deviation for each covariate are calculated. Respecting this
result, another 1000
PN
6 matrix is generated. For each column, the generated
data assume normal distribution with a corresponding mean and standard
deviation that are rounded to integers (disregarding that the rounding may
shift the mean and deviations for each column).
After a Cox regression and a least square fit for the cumulative baseline
hazard as we did before, the baseline hazard for the NN generated data is
plotted as a function of time. It is compared to the baseline hazard function
we found before for the original hospital data, as shown in Figure 5.
Further more, define the score function
s
(
x, β
)=
x
τ
×
·
β.
(4
.
2)
Then the hazard function changes to be
h
(
t
|
x
i
)=
h
0
exp(
s
)
.
(4
.
3)
The score function determines the risk of death. The higher score, the more
likely a patient will die (or will die sooner).


Search WWH ::

Custom Search