Biomedical Engineering Reference
In-Depth Information
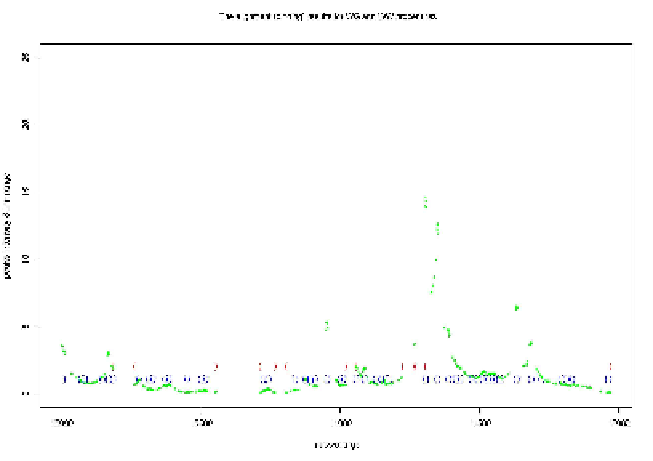
Fig. 9.
Comparison binning results of WW (upper-row) and WPSB (lower-row) proce-
dures.
cates and calculates the area beneath peaks. As mentioned in [21], a broad
range of mass spectrometers are used in MS based proteomics research.
Each type of instrument processes a unique design, data system and per-
formance specications, resulting in strengths and weaknesses for dierent
types of experiments. However, the original raw data formats produced by
each type of mass spectrometer also dier. A so-called mzXML format was
introduced, using instrument-specic converters, as an open, genetic XML
(extensible markup language) representation of MS data
21
. To nd a com-
mon mathematical representation of MS data signals, we assume, in a very
recent discussion
13
, the ion cloud as
P
k
k
k
and model the output MS
data f after the TOF instrument I as
X
X
I(
k
k
) =
k
k
(
k
):
k
k
We hope to separate the output signal into two parts:
X
X
k
k
(
k
) +
k
k
(
k
)
k
<
j
k
j
and expect the second term to be used to remove both baseline and noise.
If the peak locations are determined, say by the mean spectrum method
20
,


Search WWH ::

Custom Search