Biomedical Engineering Reference
In-Depth Information
We use the median value of this range to stand for the mass/charge for all
the peaks all in this range. Thus, we are able to provide a pn matrix.
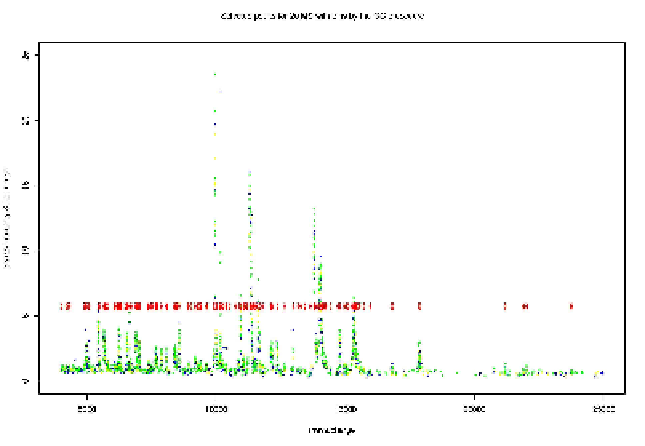
Fig. 6.
Peaks and the bin ranges of 20 MS data sets after GG binning.
In Table 1, we made some summary statistics for these methods. For
these 20 spectra, the alignment method by the GG procedure provides
258 bins, which means it identied 258 peaks. Equivalently, the alignment
method by the WW procedure identied 60 peaks, and that of WPSB pro-
cedure identied 674 peaks. Obviously, it showed that the window-based
alignment by the WW procedure generated relatively wide bin range com-
pare to the PSB alignment method.
Figure 9 gives comparisons on the alignment results for the WW and
WPSB procedures. To take a closer look at this, we only plotted the
mass/charge range between 10000 Da and 12000 Da in the gure. We can
see that the bins from WW procedure (with ( ) in red color) could not able
to separate some distinctive peaks, while the bins from WPSB procedure
(with ( ) in blue color) look very reasonable.
This application shows that the WPSB procedure has advantages among
these procedures.


Search WWH ::

Custom Search