Global Positioning System Reference
In-Depth Information
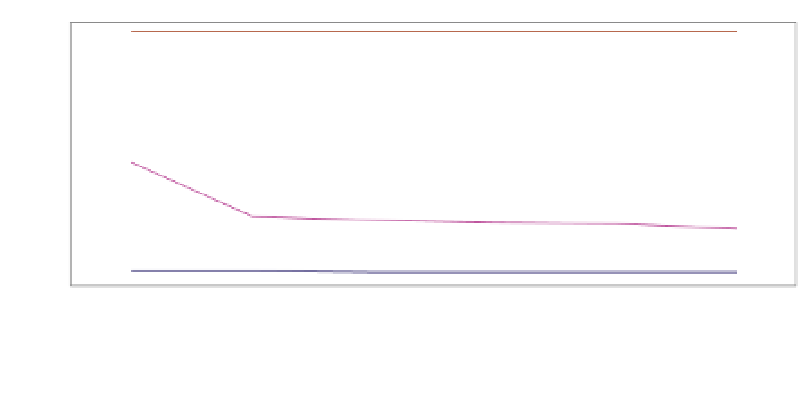
number of consecutive data points varies by county with a 40-foot buffer size. No significant
improvements are identified in the percentage of FN for the three counties as the number of
consecutive data points varies, except for Portage County data that presents a decrease in
the amount of FN when increasing the number of consecutive data points from three to four.
25
20
15
10
5
0
3
4
5
6
7
8
Number of Consecutive Data Points
Columbia
Portage
Polk
Fig. 15. Average Percentages of FN After Applying Algorithm by Number of Consecutive
Data Points and County
The percentage of solved spatial mismatches increased as the number of consecutive data
points increased. Eight consecutive data points solve almost 100% of initial incorrect snaps
for Columbia County data when employing a 40-foot buffer. The largest percentage of
solved mismatches (over 70%) after applying the algorithm occurs with a 50-foot buffer for
Portage County. While the percentage of solved cases in Polk County remained constant at
50%, as the buffer size and number of consecutive data points increased. The results of this
analysis show that increasing the number of consecutive data points solves a larger number
of spatial ambiguities. By increasing this number, the algorithm resolves ambiguities that
arise when alternative roadway centerlines are equally viable.
4.3.4 Temporal resolution
The outcome of the map-matching technique is not only affected by spatial inaccuracies, it is
also influenced by the collection frequency of the data points. As temporal resolution
increases, the tracking of the vehicle becomes more accurate. On the other hand, the
sampling interval impacts the sizes of the data sets. Processing of large data sets takes
significant CPU time, and increases storage requirements. Hence, there is a tradeoff between
decreasing the sampling interval and quality of collected speed data.
Data sets collected in Columbia County with an original 2-second time interval were
processed to generate data files with lower temporal resolutions varying from 2 to 30 with
increments of 4 seconds. Similarly, data collected every 10 seconds in Portage and Polk
counties were processed to create data files with temporal resolutions equal to 10, 20, and 30
seconds, respectively. The speed range and number of consecutive points remained constant
with values 25 mi/h and 5, respectively.


Search WWH ::

Custom Search