Graphics Reference
In-Depth Information
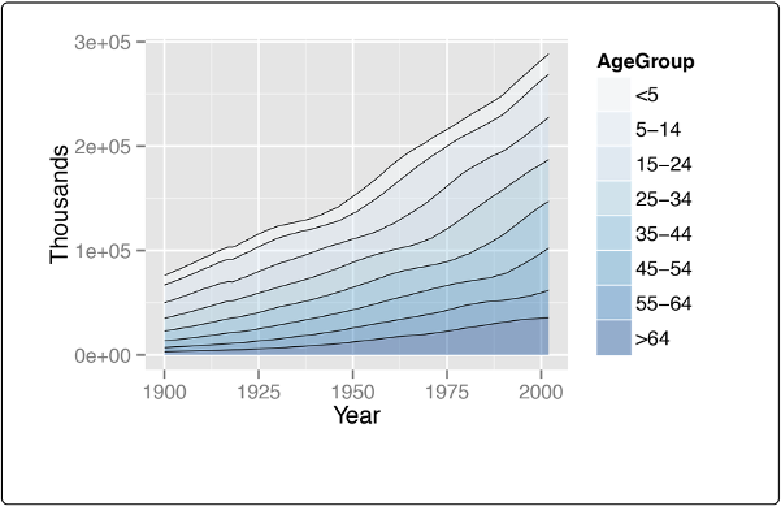
Figure 4-23. No lines on the left and right of the graph
See Also
See
Converting Data from Wide to Long
for more on converting data from wide to long format.
For more on reordering factor levels, see
Changing the Order of Factor Levels
.
See
Chapter 12
for more on choosing colors.
Making a Proportional Stacked Area Graph
Problem
You want to make a stacked area graph with the overall height scaled to a constant value.
Solution
First, calculate the proportions. In this example, we'll use
ddply()
to break
uspopage
into
groups by
Year
, then calculate a new column,
Percent
. This value is the
Thousands
for each
row, divided by the sum of
Thousands
for each
Year
group, multiplied by 100 to get a percent
value: