Graphics Reference
In-Depth Information
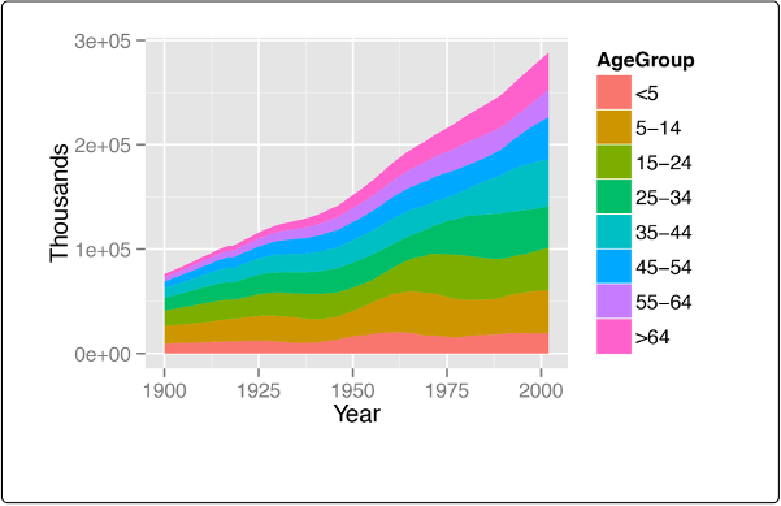
Solution
library(gcookbook)
# For the data set
ggplot(uspopage, aes(x
=
Year, y
=
Thousands, fill
=
AgeGroup))
+
geom_area()
Figure 4-20. Stacked area graph
Discussion
The sort of data that is plotted with a stacked area chart is often provided in a wide format, but
ggplot2()
requires data to be in long format. To convert it, see
Converting Data from Wide to
In the example here, we used the
uspopage
data set:
uspopage
Year AgeGroup Thousands
1900
<
5
9181
1900
5
-
14
16966
1900
15
-
24
14951