Graphics Reference
In-Depth Information
geom_point(shape
=
21
, size
=
3
, position
=
pd)
+
scale_fill_manual(values
=
c(
"black"
,
"white"
))
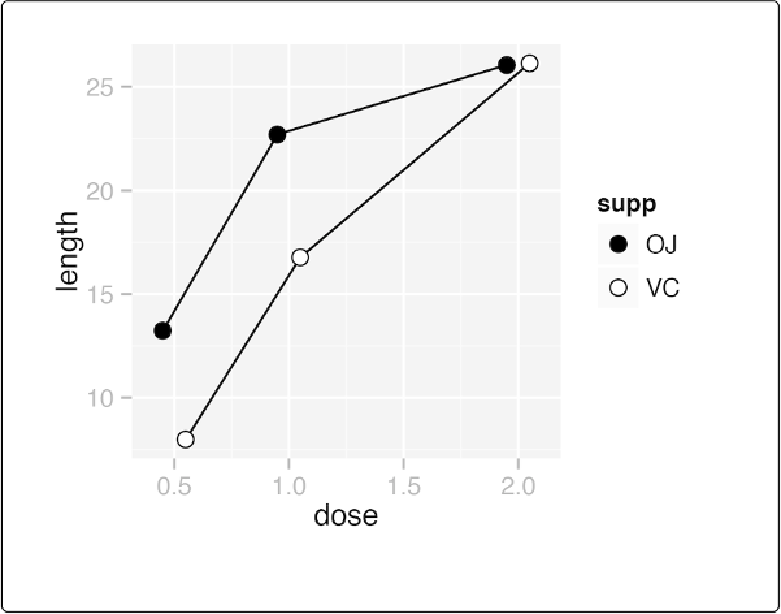
Figure 4-16. Line graph with manually specified fills of black and white, and a slight dodge
See Also
See
Using Diferent Point Shapes
for more on using different shapes, and
Chapter 12
for more
about colors.
Making a Graph with a Shaded Area
Problem
You want to make a graph with a shaded area.