Graphics Reference
In-Depth Information
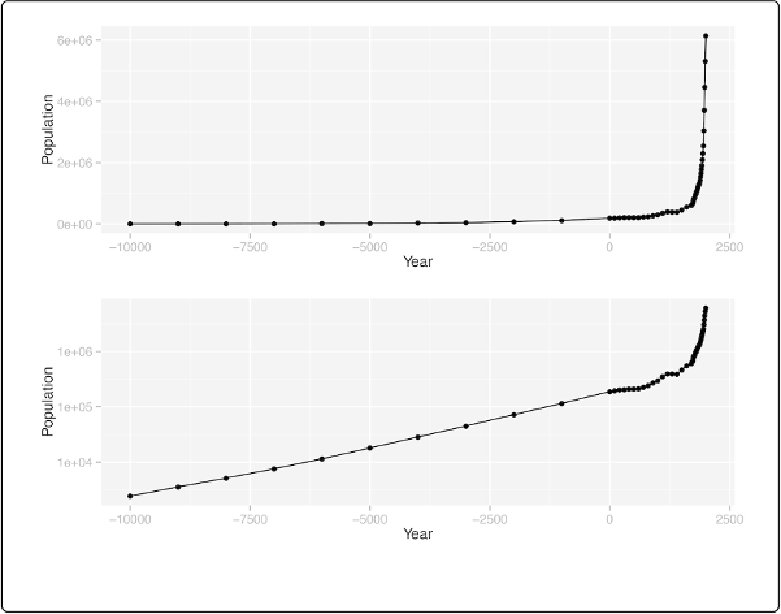
Figure 4-5. Top: points indicate where each data point is; bottom: the same data with a log y-axis
With the log y-axis, you can see that the rate of proportional change has increased in the last
thousand years. The estimates for the years before 0 have a roughly constant rate of change
of 10 times per 5,000 years. In the most recent 1,000 years, the population has increased at a
much faster rate. We can also see that the population estimates are much more frequent in recent
times—and probably more accurate!
See Also
To change the appearance of the points, see
Changing the Appearance of Points
.