Graphics Reference
In-Depth Information
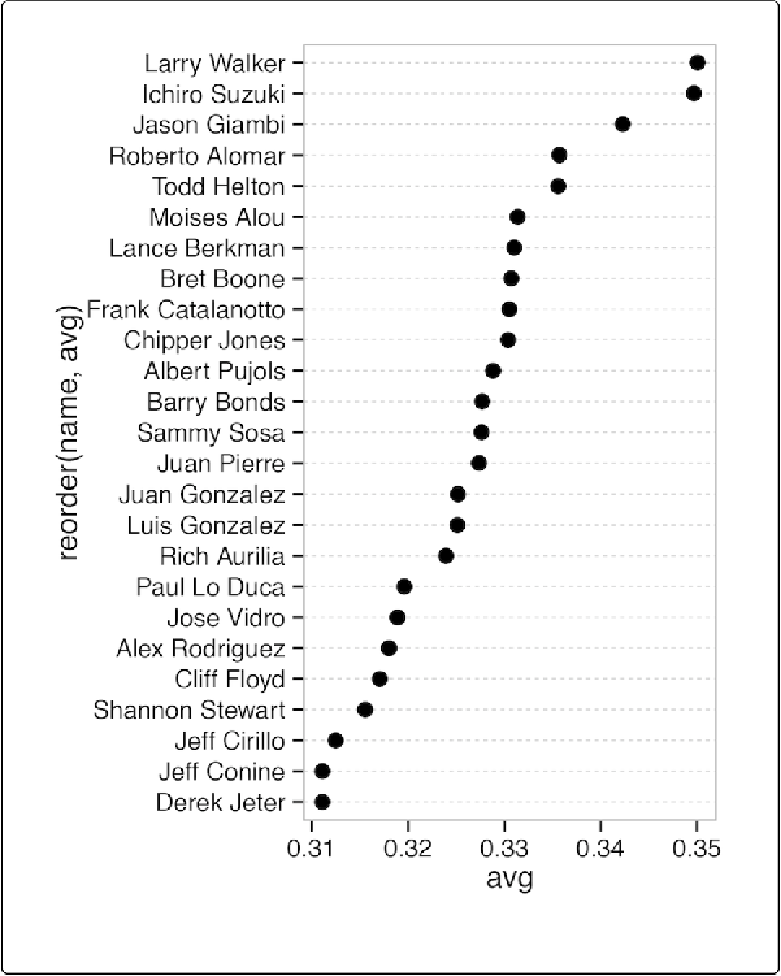
Figure 3-28. Dot plot, ordered by batting average
Previous Page
Next Page
R Graphics
Search WWH ::
Custom Search
Home