Graphics Reference
In-Depth Information
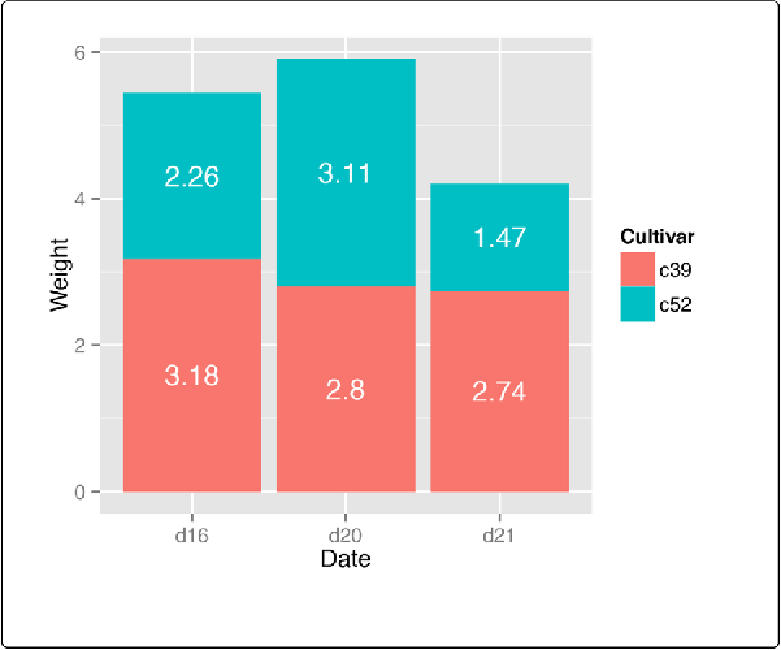
Figure 3-25. Labels in the middle of stacked bars
For a more polished graph (
Figure 3-26
), we'll change the legend order and colors, add labels
in the middle with a smaller font using
size
, add a “kg” using
paste
, and make sure there are
always two digits after the decimal point by using
format
:
ggplot(ce, aes(x
=
Date, y
=
Weight, fill
=
Cultivar))
+
geom_bar(stat
=
"identity"
, colour
=
"black"
)
+
geom_text(aes(y
=
label_y, label
=
paste(format(Weight, nsmall
=
2
),
"kg"
)),
size
=
4
)
+
guides(fill
=
guide_legend(reverse
=
TRUE
TRUE
))
+
scale_fill_brewer(palette
=
"Pastel1"
)