Graphics Reference
In-Depth Information
c39 d21
2.74 0.9834181 10 0.31098410
2.74
c52 d21
1.47 0.2110819 10 0.06674995
4.21
ggplot(ce, aes(x
=
Date, y
=
Weight, fill
=
Cultivar))
+
geom_bar(stat
=
"identity"
)
+
geom_text(aes(y
=
label_y, label
=
Weight), vjust
=
1.5
, colour
=
"white"
)
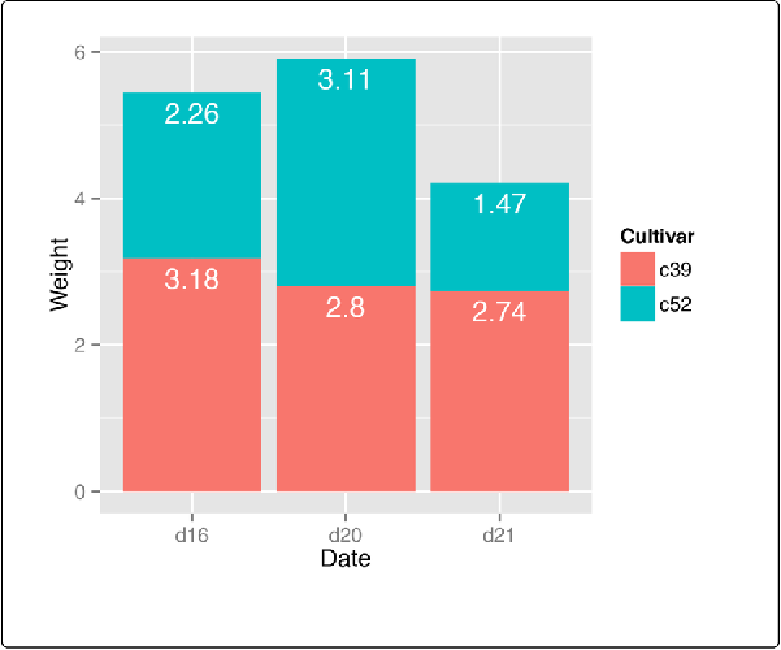
The result is shown in
Figure 3-24
.
Figure 3-24. Labels on stacked bars
When using labels, changes to the stacking order are best done by modifying the order of levels
in the factor (see
Changing the Order of Factor Levels
)
before taking the cumulative sum. The
other method of changing stacking order, by specifying
breaks
in a scale, won't work properly,
because the order of the cumulative sum won't be the same as the stacking order.