Graphics Reference
In-Depth Information
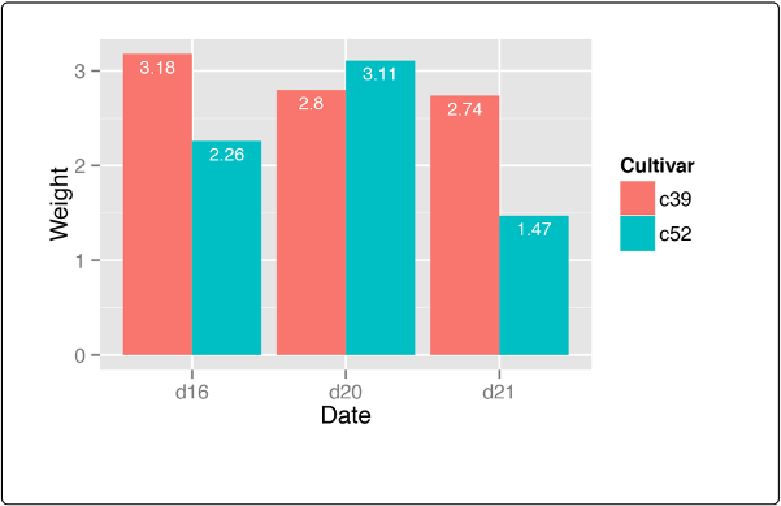
Figure 3-23. Labels on grouped bars
Putting labels on stacked bar graphs requires finding the cumulative sum for each stack. To do
this, first make sure the data is sorted properly—if it isn't, the cumulative sum might be calcu-
lated in the wrong order. We'll use the
arrange()
function from the plyr package, which auto-
matically gets loaded with ggplot2:
library(plyr)
# Sort by the day and sex columns
ce
<-
arrange(cabbage_exp, Date, Cultivar)
Once we make sure the data is sorted properly, we'll use
ddply()
to chunk it into groups by
Date
, then calculate a cumulative sum of
Weight
within each chunk:
# Get the cumulative sum
ce
<-
ddply(ce,
"Date"
, transform, label_y
=
cumsum(Weight))
ce
Cultivar Date Weight sd n se label_y
c39 d16
3.18 0.9566144 10 0.30250803
3.18
c52 d16
2.26 0.4452215 10 0.14079141
5.44
c39 d20
2.80 0.2788867 10 0.08819171
2.80
c52 d20
3.11 0.7908505 10 0.25008887
5.91