Graphics Reference
In-Depth Information
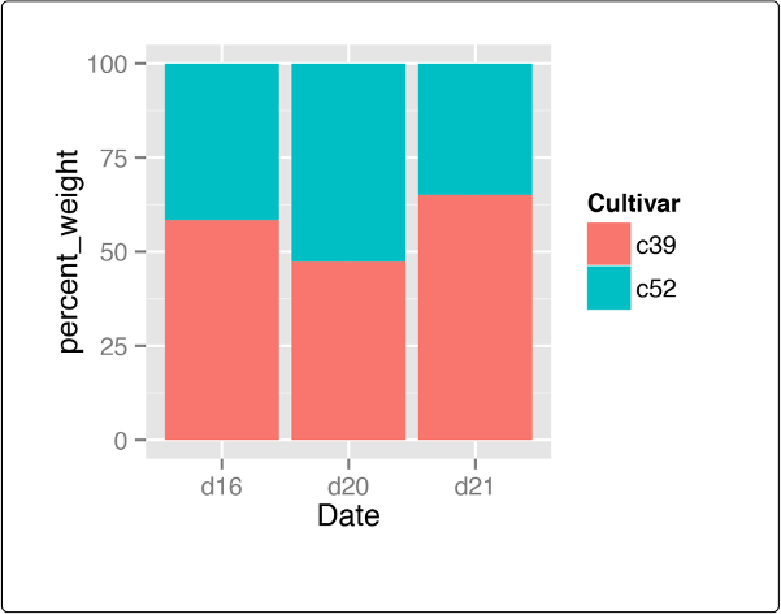
Solution
First, scale the data to 100% within each stack. This can be done by using
ddply()
from the
library(gcookbook)
# For the data set
library(plyr)
# Do a group-wise transform(), splitting on "Date"
ce
<-
ddply(cabbage_exp,
"Date"
, transform,
percent_weight
=
Weight
/
sum(Weight)
*
100
)
ggplot(ce, aes(x
=
Date, y
=
percent_weight, fill
=
Cultivar))
+
geom_bar(stat
=
"identity"
)
Figure 3-20. Proportional stacked bar graph