Graphics Reference
In-Depth Information
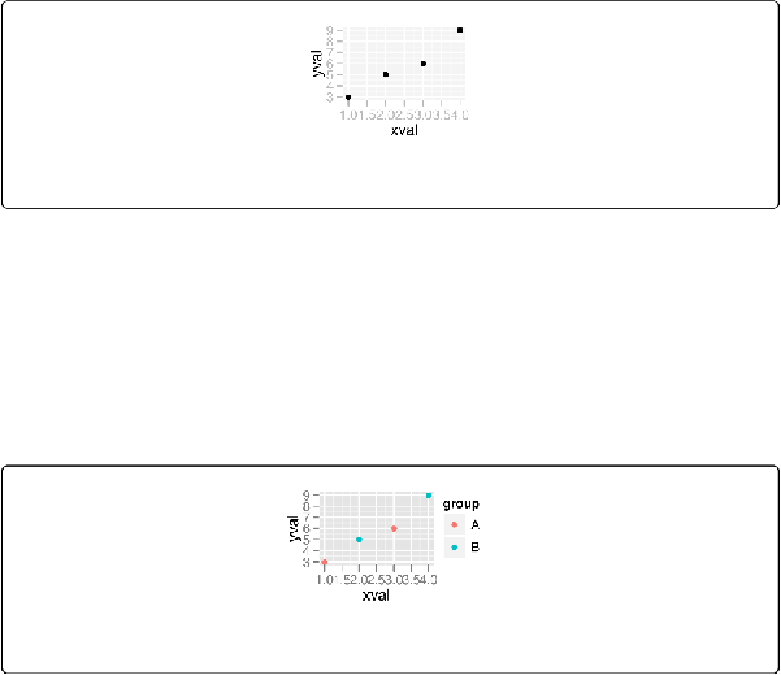
Figure A-7. A basic scatter plot
If you're going to reuse some of these components, you can store them in variables. We can save
the
ggplot
object in
p
, and then add
geom_point()
to it. This has the same effect as the pre-
ceding code:
p
<-
ggplot(dat, aes(x
=
xval, y
=
yval))
p
+
geom_point()
We can also map the variable
group
to the color of the points, by putting
aes()
inside the call
to
geom_point()
, and specifying
colour=group
:
p
+
geom_point(aes(colour
=
group))
Figure A-8. A scatter plot with a variable mapped to colour
This doesn't alter the defaultaesthetic mappings that we defined previously, inside of
gg-
plot(...)
. What it does is add an aesthetic mapping for this particular geom,
geom_point()
.
If we added other geoms, this mapping would not apply to them.
Contrast this aesthetic mappingwith aesthetic setting. This time, we won't use
aes()
; we'll just
set the value of
colour
directly:
p
+
geom_point(colour
=
"blue"
)