Graphics Reference
In-Depth Information
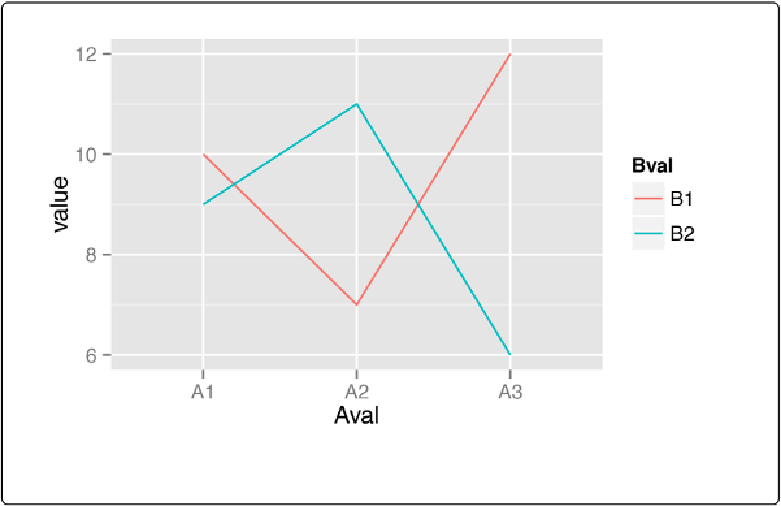
Figure A-6. A line graph made with ggplot() and geom_line()
With base graphics, we had to use completely different commands to make a line graph instead
of a bar graph. With ggplot2, we just changed the geomfrom bars to lines. The resulting graph
also has important differences from the base graphics version: the yrange is automatically ad-
justed to fit all the data because all the lines are drawn together instead of one at a time, and the
x-axis remains categorical instead of being converted to a numeric axis. The ggplot2 graphs also
have automatically generated legends.
Some Terminology and Theory
Before we go any further, it'll be helpful to define some of the terminology used in ggplot2:
▪ The datais what we want to visualize. It consists of variables, which are stored as columns
in a data frame.
▪ Geomsare the geometric objects that are drawn to represent the data, such as bars, lines,
and points.
▪ Aesthetic attributes, or aesthetics, are visual properties of geoms, such as xand yposition,
line color, point shapes, etc.
▪ There are mappingsfrom data values to aesthetics.